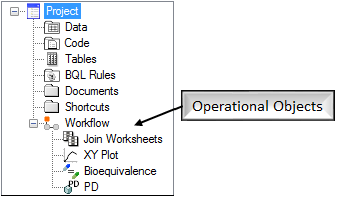
Phoenix analysis work is done using operational objects. An operational object contain a pointer to input data, a model, plot, or some other function, plus worksheet results, plot results, and text results.
What are the types of operational objects?
Examples of operational objects include data manipulation objects such as Column Transformation and Pivot Worksheet, models like Semicompartmental Modeling and PK Models, and plots like the XY Plot.
What types of data do operational objects use?
Operational objects use two types of data: external and internal.
-
An external data source for an operational object points to an imported dataset in the Data folder. The data is not contained in the object.
-
Internally generated data sources include worksheets created within Phoenix. These can be created either by users or by executing an operational object to get output results. These data are also not contained in the object.
The output of one operational object can be connected to the input of another operational object to perform a series of calculations based on the other object’s results. For example, the Final Parameters worksheet from a model can be sent to a Descriptive Stats object for further analysis.
How are operational objects used?
All operational objects can be inserted from the Insert menu, the Object toolbox, the Send To menu, and the workflow menu. They have user-defined settings and options that can be accessed in the Setup tab list and in the option tabs located beneath the Setup tab. Results in the form of worksheets, plots, and text, which are output from an executed operational object.
An operational object is an operational function that is added to the workflow object in a project, accepts input data, has user-defined settings, and gives output results. It has links to objects in the Data, Code, or BQL Rules folder, or has links to other operational objects
This section contains information about the following topics:
•Inserting operational objects into a project or workflow
Inserting operational objects into a project or workflow
Operational object menus in Phoenix are arranged by groups. There are several ways to insert an operational object, but the operational object menus are always grouped the same way.
Insert an operational object in one of the following ways.
-
Select a project or workflow in the Object Browser and then select the Insert > <Mouse Click> (object group) > (operational object) menu item.
-
Select a workflow in the Object Browser. On the left side of the Diagram tab that is displayed, click the object button in the Object Toolbox.
-
Right-click a workflow in the Object Browser and then select New > <Mouse Click> (object group) > (operational object) from the menu.
-
Right-click a data set in the Data folder or a results worksheet and then select Send To > <Mouse Click> (object group) > (operational object) from the menu.
The object is added to the project in the Object Browser and to the workflow Diagram tab. In addition, the inserted object is automatically opened in the right viewing panel. Each object’s default view is the Setup tab, which contains all the steps necessary to set up an object.
Note:Any object added to a project can be viewed in its own window by selecting the object in the Object Browser and double-clicking it or pressing the ENTER key. All instructions for setting up and executing an object are the same whether the object is viewed in its own window or in Phoenix’s viewing panel.
Every operational object has a Setup tab, which contains a list of items that must be specified before a model or other operational object can be executed. Each Setup tab has two common items: a panel used to map a dataset to an object’s input and a toolbar. Some operational objects contain an additional tab used to sort the input columns or the output columns.
The following topics are discussed in this section:
•Output Sort Order and Input Column Order tabs
Each item in the Setup tab list contains a toolbar. The Setup tab toolbar allows users to select a data source, copy an internal worksheet to the Data folder, and view or delete the mapped data source.

-
Select source identifies an input data source for a Setup tab item.
-
Publish source copies an internal worksheet to the Data folder. (This button is only available for internal worksheets.)
The Select Object dialog is displayed. Select the Data folder or a worksheet in the Data folder in which to place the worksheet and click Select.
Copying an internal worksheet to the Data folder converts the worksheet to an external source and automatically maps the column headers in the worksheet to the context associations. -
Toggle source data panel displays the external source mapped to the Setup tab item. (This button is only available if a Setup tab list item has an external worksheet mapped to it.)
-
Remove source unmaps an external source worksheet from an operational object.
-
Load Object Settings displays the Load Object Settings dialog for selecting a saved settings file, in the default settings directory, to apply to the selected object.
-
Import Object Settings displays the Import Object Settings dialog for selecting a saved settings file, not in the default settings directory, to apply to the selected object.
-
Save Object Settings displays the Save Object Settings dialog for saving the current object settings to a file for later use.
-
The pull-down menu lists all of the saved settings files that are located in the default settings directory and pertain to the selected object type. Selecting one from the menu displays a confirmation dialog for applying the settings. Click Yes to load the settings.
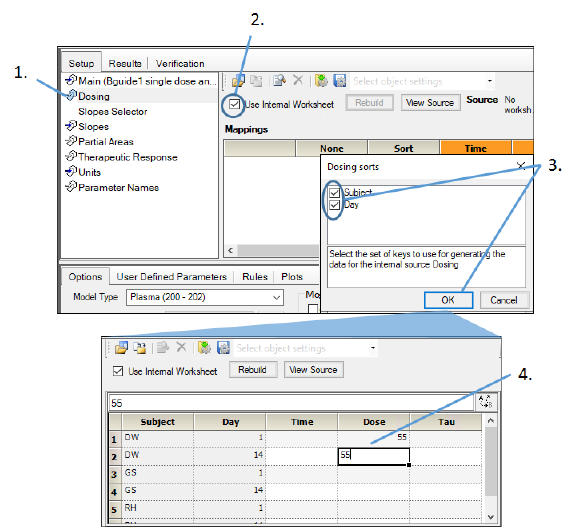
Users do not have to use an external worksheet to provide input to operational objects. Internal worksheets can be used to enter the information necessary to set up an operational object.
Note:The primary data input for any operational object does not allow users to manually enter data.
-
Select an item in the Setup tab list other than the primary data input.
-
Select the Use Internal Worksheet checkbox.
If the operational object uses sort keys Phoenix displays a dialog asking users to select the set of sort keys used to create the internal worksheet. -
Select or clear the checkboxes beside the sort keys to choose which ones to use and click OK.
An internal worksheet is created based on the selected sort keys and the type of input it provides. -
Use the information presented in “Editing data values in worksheets” to add the rows and columns of input data.
Note:The Rebuild button in the mappings panel can be used to rebuild the worksheet, incorporating any changes that affect the contents of the worksheet.
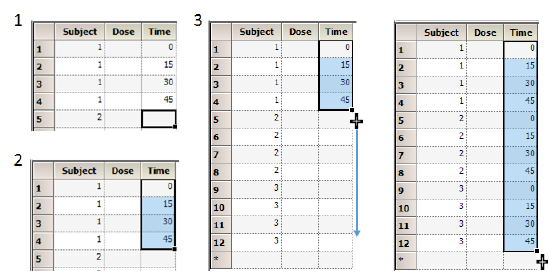
When entering data manually into cells, there are a couple of features that can help with copying and moving values.
To use the drag and fill feature to propagate values
-
Enter the value(s) to propagate.
-
Use the pointer to highlight those cells.
-
Place the pointer over the black square on the lower right side of the selection and, when the pointer changes shape, press the left mouse button and drag the selection down or across to fill the other cells.
In the image above, the same set of times when a dose is administered is being propagated to all subjects.
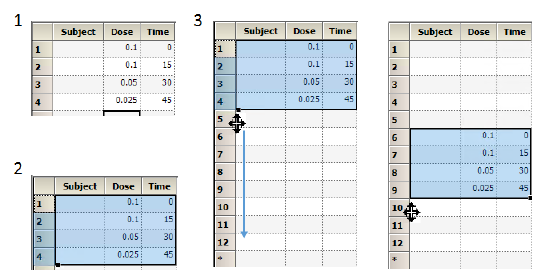
To use the drag feature to move values
-
Enter the value(s).
-
Use the pointer to highlight the entire row(s).
-
Place the pointer over the black square on the lower left side of the selection and, when the pointer changes shape, press the left mouse button to drag the selected row of values to the destination row.
Output Sort Order and Input Column Order tabs
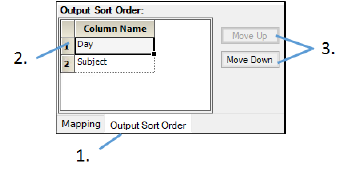
Most operational objects have an Output Sort Order tab used to arrange results worksheets based on the sort keys mapped in the primary data input. The Output Sort Order tab is located beside the Mapping tab.
-
Select the Output Sort Order tab.
Data types mapped to the object’s Sort context are listed. -
Select a column name.
-
Click the Move Up or Move Down buttons to change the position of the columns.
Results worksheets are sorted based on the selections made in the Output Sort Order tab.
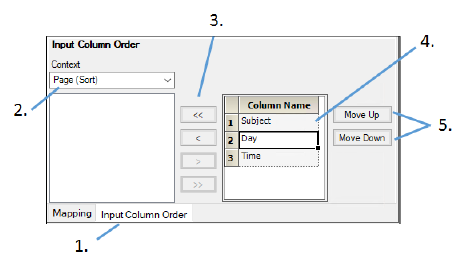
The plotting operational objects have an Input Column Order tab used to sort the input columns used to create charts. Users can select column headers mapped to different sorting contexts and specify how the points, bars, or lines are sorted in the output.
-
Select the Input Column Order tab.
-
From the Context menu select the context to which the sort keys are mapped.
Plot objects have multiple sorting contexts, so the menu options are different for each plot object.
The data types mapped to the selected context are displayed underneath the Context menu. -
Select a sort key and click the > and < buttons to move the selected sort key from one list to the other. Use the >> and << buttons to move all sort keys between the lists.
-
Select a column name.
-
Click the Move Up or Move Down buttons to change the position of the columns.
An Object Settings file contains all of the settings used with an operational object and is saved as a .phxsetting file. The Object Settings file can be used to expedite future analysis of operational objects that are created to perform complex or specific functions. The file contains the specific configuration of an operational object, but does not contain the original data input sources. The configuration in the file can be loaded into an operational object of the same type or it can be specified as the default configuration for that object type, so that the settings in the file are loaded when each new operational object of that type is added to a workflow.
Note:Unlike other objects, the Data Wizard can contain many steps. Saving and loading object settings for Data Wizard objects includes settings for all steps, but input mappings for the first step only.
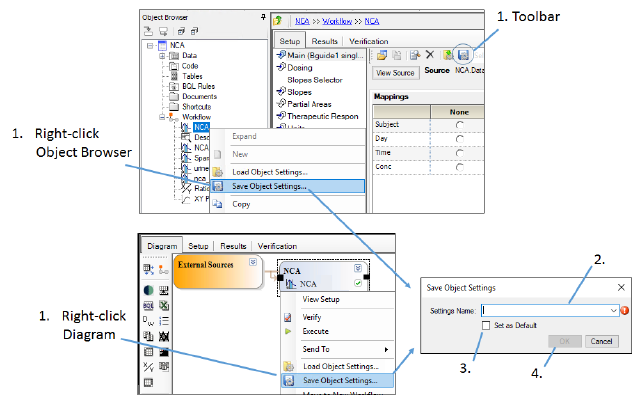
To save object settings
Once an object has the desired settings it can be saved to an Object Settings file. The default location for saved Object Settings files is set by Phoenix (see “To set object settings preferences for operational objects”).
-
With the object selected in the Object Browser, click
 in the Setup tab toolbar or right-click the object in the Object Browser or Diagram and select Save Object Settings.
 -
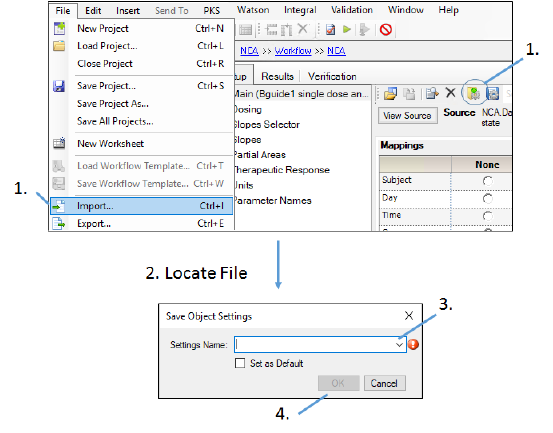
In the Save Object Settings dialog, enter a name for the file.
-
Check the Set as Default checkbox if you want this settings file to be used as the default settings whenever an object of the same type is inserted in Phoenix.
-
Click OK.
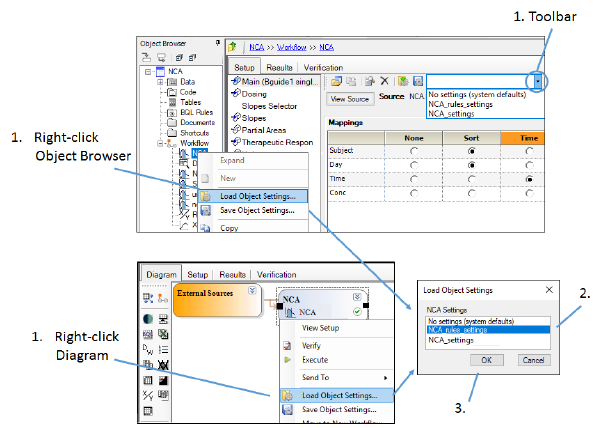
To load object settings to an existing object
-
With the object selected in the Object Browser, choose the settings file from the pull-down list in the Setup panel toolbar or right-click the object in the Object Browser or Diagram and select Load Object Settings.
-
In the Load Object Settings dialog, select the settings file from the list available for the same operational object type.
-
Click OK.
Note:Selecting the No settings (system defaults) option doesn’t apply any user-specified settings, so that the Phoenix default settings are used.
A note about internal and external worksheet handling
If an internal worksheet has one or more Sorts, then this indicates that the worksheet is data-specific and would not be applicable to other data, so it is not saved with the object settings. If there is no Sort in an internal worksheet (e.g., the same dosing or partial area was applied to all Sorts), then that internal worksheet is saved with the object settings and will be applied when those object settings are loaded. Thus, worksheets that do not allow for Sorts (e.g., NCA Parameter Names, NCA Units, and BQL Rules) will always be saved and loaded with object settings.
External mapped worksheets have priority over internal worksheets. If an external worksheet is mapped as an auxiliary worksheet in an object (e.g., NCA Dosing worksheet) and the object settings that are loaded have an internal worksheet saved with them, the external worksheet and mappings will override.
To apply an imported object settings file
-
Click
 in the Setup toolbar for the operational object or select File > Import
 -
In the file browser, navigate to and select the desired object settings file.
(The settings file must be for the same object type.) -
In the Save Object Settings dialog, enter a name for the settings file for use in Phoenix.
The settings are automatically loaded from the selected file and the settings file is managed by Phoenix.
To set object settings preferences for operational objects
-
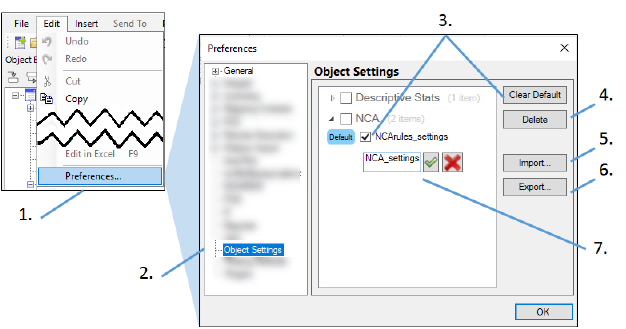
Select Edit > Preferences.
-
In the Preferences dialog, select Object Settings.
-
To specify the default settings for an operational object, select the object settings file to use as the default and click the Set Default button.
-
To delete object settings file(s) from the file system, select the file(s) and click Delete.
-
To import object settings file(s) that have been exported into the Settings directory, click Import or from the object’s Setup panel, click
 in the toolbar (see “To load object settings to an existing object” for more information).
 -
To export object settings file(s), select the file(s) and click Export. In the dialog, select the directory to which the files are to be exported and click OK.
-
To rename object settings file(s), double-click the settings name and type the new name.
If only the default setting for an object is selected, the Set Default button will change to Clear Default. Clicking the Clear Default button returns to a state where none of the user-specified settings are applied by default and the Phoenix default settings will be used for any new objects.
Exported settings files can be shared with other users.
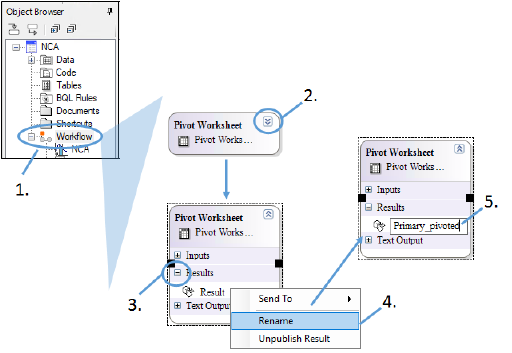
Prior to the execution of an object, the name of the results worksheets, plots, and text files can be changed through the Diagram tab.
-
Select the Workflow in the Object Browser to display the Diagram tab.
-
Click
 to expand the desired object.
 -
Click + next to Results, Text Output, or Plots to expand the list of output items.
-
Right-click the item, and select Rename.
-
The name of the output item becomes editable and you can type in a new name.
The results of any operational object are located in the Results tab. There are four types of output created by operational objects:
Each type of output has its own set of options.
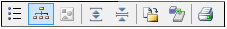
The Results tab also contains a toolbar that allows users to group, save, and print the results.
-
Do not group lists the output alphabetically.
-
Group by type lists the output in grouped by type.
-
Group by executable lists the output grouped by operational object. Group by executable is only available in the workflow object’s Results tab.
-
Expand all results shows all results items in the list.
-
Collapse all results collapses results so only the group headings are visible.
-
Copy to Documents copies the selected item to the Data, Tables, or Documents folder.
-
Export exports and saves the selected item.
-
Print sends the selected object to the printer.
An out-of-date result is shaded pink in the Object Browser. If the result is open in a separate window (by double-clicking the item in the Object Browser), the title bar will show “(Out of Date)” after the title. A result is considered out-of-date if some part of the operational object or its source data are changed after the object is executed.
Result worksheets cannot be edited unless they are exported or copied to the Data folder. They are shaded gray to denote that they cannot be edited.
To use a results worksheet as input
Right-click a worksheet in the Results tab and select Send To > (Object group) > (Operational object).
The operational object is added to the workflow and the result worksheet is mapped to it as the primary input data source. This is much simpler than exporting the worksheet or copying the worksheet to the Data folder.
To copy a result worksheet to the Data folder
Select the worksheet and click  or right-click the worksheet and select Copy to Data Folder.
Note:When a Data Wizard result worksheet is copied to the Data folder, the History tab will also contain all of the history records from the source worksheet that was mapped into the Data Wizard.
To save a worksheet
Select the worksheet and click  or right-click the worksheet and select Export.
In the Save Object dialog, select an export location and a file format and click Save.
To print a worksheet
Select the worksheet and click  or right-click the worksheet and select Print.
In the Print dialog, click OK to print the worksheet.
Result plots can be edited like any other plot object. Editing a plot does not mark an object as out of date, because Phoenix automatically updates the object as the plot is edited.
To copy a plot to the Windows clipboard
Right-click the plot and select the image format to use when copying the plot to the clipboard: Copy high resolution image (vector) or Copy image (bitmap).
To save a single plot to a file
Right-click the plot image and select Export.
In the Export dialog, select a location and a file type, then enter a name for the file.
In the Image Settings part of the dialog, make any changes to the size of the image and click Save.
To export all plot images associated with a result plot
Select the result plot in the Results tab and click  .
.
In the Export dialog, select an export location and a file format.
In the Image Settings dialog, make any changes to the size of the image and click OK.
If there are multiple tabs of plots for the selected plot result, all of the plots in all of the tabs are exported as the selected file type. For example, if there are five tabs of plots in the results and the selected filetype is JPEG, five separate JPEG files are saved and named sequentially.
To print a plot
Select the plot and click  .
.
In the Print dialog, click Print to print the plot.
Result text files typically contain object settings and a plain text version of the worksheet output.
Note:Right-clicking a text file and using the Send To menu creates a new object, but does not map the text file to the object.
To copy a result text file to the Documents folder
Select the text file and click  or right-click the text file and select Copy to Documents.
To save a text file
Select the text file and click  or right-click the text file and select Export.
In the Save Object dialog, select an export location and a file format and click Save.
Note:For rtf file format, if the exported file contents do not appear to line up properly, change the font to Courier New 9pt.
To print a text file
Select the text file and click  or right-click the text file and select Print.
In the Print dialog, click OK to print the text file.
Note:Right-clicking a table and using the Send To menu creates a new object, but does not map the table to the object.
To copy a result table to the Tables folder
Select the table and click  or right-click the table and select Copy to Tables folder.
To save a table
Select the table and click  or right-click the table and select Export.
In the Save Object dialog, select an export location and click Save.
To print a table
Select the table and click  or right-click the table and select Print.
In the Page Setup dialog, edit the page setup and click OK.
In the Print dialog, click OK to print the table.
