The Phoenix Model Comparer is an operational object that can compare any executed Phoenix Model in a project, calculate differences between some model diagnostics, as well as calculate p-values for nested models.
Use one of the following to add a Phoenix Model Comparer object to a Workflow:
Right-click menu for a Workflow object: New > Phoenix Modeling > Phoenix Model Comparer.
Main menu: Insert > Phoenix Modeling > Phoenix Model Comparer.
Right-click menu for a worksheet: Send To > Phoenix Modeling > Phoenix Model Comparer.
Note:To view the object in its own window, select it in the Object Browser and double-click it or press ENTER. All instructions for setting up and execution are the same whether the object is viewed in its own window or in Phoenix view.
This section contains information on the following topics:
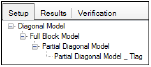
The Setup tab lists all the Phoenix Model objects in a project.
Note:Avoid having multiple Phoenix Model objects with the same name, even if they are in different workflows. Model Comparer will include all models with the same name in the comparison, even if their Compare boxes are not checked (they will become checked at execution). If the names cannot be changed for some reason, be sure to use the Hide checkboxes next to the model objects that are not wanted for the comparison.
If a Phoenix Model object was created by making a copy of a previous Phoenix Model, then the copy is nested underneath the first model in the Comparison panel. The original model is the root model, and the copied model is the child.
Model copies that are nested underneath the original model will typically have additional parameters that are compared against the original model, which has fewer parameters.
In the Setup tab users can change the hierarchical relationship between root and sub-models.
-
Use the pointer to select a model in the Setup tab and drag the model on top of another model.
-
In the dialog, click Yes to confirm the move.
The selected model is nested underneath the selected root model.
-
To move a child model back to the root level, right-click the child model and select Orphan Model.
-
In the dialog, click Yes to confirm the move.
The model is moved back to the root level in the Setup tab.
Note:Although there are no icons in the Setup tab for importing/saving/loading object settings, these operations are still available using the File > Import menu, and right-clicking the object in the Object Browser or in the workflow diagram.
The area to the right of the model allows users to hide, remove, and select models to compare.
Check or uncheck the Hide or Compare checkboxes to exclude or include a model in the comparison.
•If the Hide checkbox is selected, then the model is considered “hidden” and is removed from any comparisons.
•If the Compare checkbox is selected, then the selected model is included in comparisons.
Caution:Verify that your selections in the Comparison panel are as desired before and after execution as they may revert to a prior status unexpectedly. In some cases, simply moving the mouse cursor over a checkbox changes the status.
Additional model descriptions can be entered in the Description field by clicking the field twice and typing in the field. Description is carried over to the result worksheets.
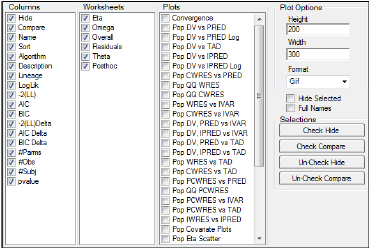
The Options tab lists all the columns, worksheets and plots available for Phoenix Model comparisons.
-
Uncheck a column checkbox to remove that column from the Comparison panel. Removed columns are not included in the output worksheets.
-
Check the checkboxes in the Worksheets and Plots lists to include worksheets and plots in the comparison results.
-
Uncheck the checkboxes in the Worksheets and Plots lists to exclude the worksheets and plots from the comparison results.
-
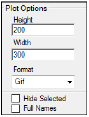
In the Plot Options area, select the height, width, and graphic format for the output plot.
-
If a Phoenix Model is marked as hidden, then check the Hide Selected checkbox to remove the model from the Setup tab. The hidden model is not used in any comparisons.
-
Check the Full Names checkbox to display the full name of a model. The full name includes the name of the workflow containing the model.
Use the buttons in the Selections area to select or hide several models at once. Multiple rows in the Comparison panel must be selected to use these buttons.

-
To select multiple rows in the Comparison panel, press and hold the CTRL key and right-click beside each row to select it.
Or
Use the pointer to select a row. Press and hold the SHIFT key and use the up or down arrow keys to select multiple rows. -
When the desired rows are selected, users can do the following:
•Click Check Hide to hide the selected models.
•Click Check Compare to include the selected models in the comparison.
•Click Un-Check Hide to not hide the models.
•Click Un-Check Compare to remove the models from the comparison.
|
Worksheet |
Content |
|
Eta |
Empirical Bayesian estimates of random differences from population expected values for each subject and occasion. |
|
Omega |
Estimates of the random effects variance-covariance matrix, correlation matrix and shrinkage. |
|
Overall |
Stacks each model 'Overall' worksheet result but doesn't present any comparison calculation. |
|
•Name: Model names being compared (as displayed in the Object Browser) |
|
|
•Description: Model description text if entered by the user in the setup tab. |
|
|
•Scenario: Name of the scenario (if applicable) |
|
|
•Retcode: Code indicating the status of the run convergence |
|
|
•LogLik: Loglikelihood |
|
|
•-2LL: –2 Loglikelihood |
|
|
•AIC: Akaike Information Criterion for each model run |
|
|
•BIC: Bayesian Information Criterion for each model run |
|
|
•nParm: Number of model parameters |
|
|
•nObs: Number of observations |
|
|
•nSub: Number of subjects |
|
|
•EpsShrinkage: Epsilon shrinkage |
|
|
Posthoc |
Compares the Posthoc worksheet estimates of selected models. |
|
Residuals |
This table stacks 'Residuals' worksheet results of each individual model with the addition of Model name and Description. |
|
•Name: Model name |
|
|
•Description: Model description |
|
|
•Scenario: Scenario name if applicable |
|
|
•ID: Subject ID |
|
|
•Time: Time |
|
|
•TAD: Time after dose |
|
|
•PRED: Population prediction |
|
|
•IPRED: Individual prediction |
|
|
•DV: Observed dependent variable. |
|
|
•IRES: Individual residual |
|
|
•PREDSE: Standard error of predicted value |
|
|
•Weight: Applied model weight |
|
|
•IWRES: Individual weighted residual |
|
|
•WRES: Weighted residual |
|
|
•CWRES: Corrected weighted residual |
|
|
•PCWRES: Predictive check weighted residuals |
|
|
•CdfPCWRES: Cumulative distribution function for predictive check weighted residual. |
|
|
•CdfDV: Cumulative distribution function for the dependent variable. |
|
|
•TADSeq: Time after dose sequence. This variable is used to produce plots with TAD. |
|
|
•ObsName: Observation Name. |
|
|
•Var. Inf. factor: The variance inflation factor (if applicable) |
|
|
Theta |
This table stacks 'Theta' worksheet result of each individual model run with the addition of Model name and Description. |
|
•Name: model name |
|
|
•Description: model description |
|
|
•Scenario: scenario name if applicable |
|
|
•Estimate: parameter estimates |
|
|
•Parameter: parameter name |
|
|
•Units: parameter units (if applicable) |
|
|
•Stderr: standard error |
|
|
•CV%: percent confidence of variation |
|
|
•lower % CI: lower confidence interval |
|
|
•upper % CI: upper confidence interval |
|
|
•Var. Inf. Factor: variance inflation factor (if applicable) |
|
|
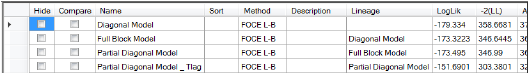
Comparison Results |
List all the columns checked under options. |
|
•Hide: Models hidden; |
|
|
•Compare: Models to be compared in the plot table; |
|
|
•Method: phoenix model engine used for each model |
|
|
•Name: is the name of the Phoenix object being compared; |
|
|
•Description: optional description of the model; |
|
|
•Lineage: List the 'parent' (i.e. reduced model) if the current model is a 'child' (derived from but with additional parameters) of another model |
|
|
•LogLik: estimate of the loglikelihood upon convergence |
|
|
•AIC: Akaike Information Criterion for each model run |
|
|
•BIC: Bayesian Information Criterion for each model run |
|
|
•-2(LL)Delta: Difference in -2LL for nested models only (Lineage-Child model) |
|
|
•AICDelta: Difference in AIC values. for nested models only (Lineage-Child model) |
|
|
•BICDelta: Difference in BIC values for nested models only (Lineage-Child model) |
|
|
•#params: Number of model parameters |
|
|
•#obs: Number of observations |
|
|
•#Subj: Number of subjects |
|
|
•p-value: Chi-Square p-value based on the Likelihood Ratio Test for nested models only. |
|
Plot |
Content |
|
Plot Table |
Illustration of all the selected plots in rows for each model being compared (columns). |
|
Text |
Content |
|
Settings |
A text format file with the list of current columns, plots and models being compared. |
