The CDISC Data Preparer object produces analysis ready datasets (SAMPLE and DOSE) in Phoenix, using CDISC formatted dataset inputs of either SDTM (Study Data Tabulation Model) or SEND (Standard for Exchange of Nonclinical Data).
•CDISC SDTM is a unified way of transmitting information in drug studies with precise column names and a common file format. CDISC Data Preparer produces output in the STDM format that is compliant with the standards in the SDTM Implementation Guide 3.1.1.
•CDISC SEND is an implementation of SDTM for nonclinical studies and specifies a consistent format for presenting and exchanging nonclinical data. The CDISC Data Preparer produces output in the SEND format that is compliant with the standards in the SEND Implementation Guide 3.0.
For further information, please visit the Clinical Data Interchange Standards Consortium Web site at www.cdisc.org.
CDISC input datasets must have the following domains in order for the CDISC Data Preparer object to generate a PK dataset:
DM: Demographic information; one row per subject
PC: PK concentrations data, one record per concentration per analyte
EX: Exposure, one record per constant dosing interval per subject
The input dataset can also include Finding domains such as:
EG: ECG tests
LB: Laboratory tests
PE: Physical examinations
QS: Questionnaire
SC: Subject characteristics
VS: Vital signs
MB: Microbiology specimens
PP: Pharmacokinetics parameters
Findings domains can contain time-dependent data, but the times do not necessarily match the times of the samples or treatments. The CDISC Data Preparer object uses processing rules to locate data corresponding to the time of data collection.
Use one of the following to add a CDISC Data Preparer object to a Workflow:
Right-click menu for a Workflow object: New > Data > CDISC Data Preparer.
Main menu: Insert > Data > CDISC Data Preparer.
Right-click menu for a worksheet: Send To > Data > CDISC Data Preparer.
Note:To view the object in its own window, select it in the Object Browser and double-click it or press ENTER. All instructions for setting up and execution are the same whether the object is viewed in its own window or in Phoenix view.
Additional information is available for the following topics:
See also “CDISC Data Preparer Example”.
Note:Required Mappings are highlighted in orange.
Add data that is to be included in the output. The Demographics panel contains an internal worksheet that can be used to manually enter concentration data, or a concentration worksheet can be mapped to it.
None: Data types mapped to this context are not included in any analysis or output.
Subject Identifier: The unique identifier of the subjects in a dataset.
Demographic: Data to include in the output datasets.
Specify how the exposure columns are treated when producing the Dose result dataset. The panel can also be used to identify the columns to use in joining the sample domain and the columns to include in the Sample dataset.
Dose context definitions:
None: Data types mapped to this context are not included in any analysis or output.
Pivot: Identifiers of the unique dose tests.
Dose: Actual dose amount.
Unit: Unit of the actual dose amount.
Carry to Dose Dataset: Data to include in the Dose result dataset.
Sample context definitions:
None: No action should be taken for the exposure field related to the Sample dataset.
Join: Set of columns to use to join the PK Findings domain. Typically, the EXSTDTC field from the EX domain is referenced in the PC domain PCRFTDTC field, and this field alone can be configured as the Join column; however, a combination of fields can be used to join the EX and PC domains.
Carry to Sample Dataset: Data to include in the Sample result dataset. It is often necessary to carry some fields from the EX domain to the Sample result dataset so that sort keys can be specified between the Dose and Sample datasets during analysis.
Specify the data from PK Findings tests.
None: Data types mapped to this context are not included in any analysis or output.
Test Identifier: Identifiers for unique PK Findings test. The unique tests are displayed in the PK Findings properties tab.
Row: Data to include, and that represent the unique set of rows. All unique combinations of Row and Join columns determine the number of sample rows in the result dataset.
Carry: Data to carry over unchanged in the output worksheets.
Each column selected as a Join column in the EX domain will appear as a column mapping context for the PC domain. This allows the user to specify what column in the PC domain corresponds to what column in the EX domain. In most cases, the EXSTDTC context will be mapped to the PCRFTDTC field in the PC domain.
Although PCTPT, PCTPTNUM, and PCELTM tabulate the same information, they each have a different format and only PCELTM has a defined standard format. Therefore, PCELTM is the variable that CDISC Data Preparer uses to calculate Relative Nominal Times for the Sample result dataset. If your datasets usually have PCTPT or PCTPTNUM instead of PCELTM, you will need to create a PCELTM column from the other column. If PCELTM is not in the dataset, or not carried along, or not in the proper format, CDISC Data Preparer generates a warning.
The PCELTM column values need to be in hours and have units of “hr” specified in the header. The column type must be text.
To create the PCELTM column from a PCTPTNUM or PCTPT column:
•Use the Data Wizard object’s Transformation action to copy the contents of the column to a new PCELTM column. You can use the arithmetic formula “x-n” and set “n” to 0.
•Create a Properties step to specify the column units as “hr” and, if the data is from a PCTPTNUM column, set the column’s data type to Text.
•If the data is from a PCTPT column, create a Filter step involving multiple filters to replace “PREDOSE” with “0”, “15MIN” with “0.25”, “30MIN” with “0.5”, “45MIN” with “0.75”, “1H” with “1”, etc.
Specify additional tests to include in the data preparation.
None: Columns mapped to this context are not used to identify the tests performed.
Pivot: The fields identified as Pivot fields are used to identify the tests to be included in the Sample results. For example, in the VS domain, the tests might be identified by the combination of the VSTEST and the VSPOS fields.
Add or remove the Other Findings items listed in the Setup.
Add Other Findings: Add another Other Findings item (displays as Other Findings1) in the Setup panel list.
Remove Other: Remove an Other Findings item from the Setup panel list. This button only removes Other Findings item that were added using the Add Other Findings button.
The Exposure tab allows users to view the list of unique exposure data combinations based on the Exposure context mappings.
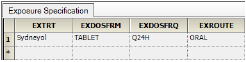
The image above shows a study where, based on the Exposure context mappings, only one exposure specification was identified.
The PK Findings tab allows users to view the unique tests that were identified using the PK Findings context mappings and select the ones to include.
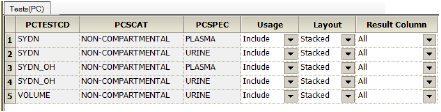
•Usage: whether to Include or Exclude the test in (from) the output.
•Layout: control the display of the test data. See the “Layout Columns” section below for more information.
Stacked: create a PCORRES and PCRSTRSN result column for each unique unit found in the source dataset for the stacked test.
Pivoted: for each pivoted test a set of result columns is added in the output.
•Result Column: the result column to include for each test (select All to include all of the results columns). Result columns are those that match the CDISC specification for results columns in original, numeric, or text format.
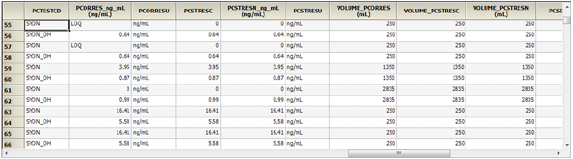
The table below shows the sets of columns that will be included in the output depending on the settings for Layout and Result Column.
For example, it would be common to stack urine concentration results for different analytes and pivot the urine volume such that the volume and concentration are shown on the same row.
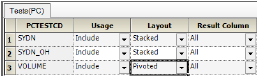
With the set up shown above, note that the SYDN and SYND_OH concentration results are stacked, and the VOLUME data are pivoted to align with the concentrations.
Select data from multiple other findings domains that were identified using the Other Findings context mappings to include in the Sample output. Data is extracted from these datasets by finding the tests corresponding to subjects and occurring within a specified time-window relative to the concentration sample collection time.
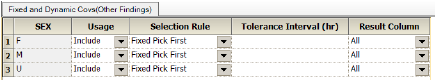
•Usage: whether to Include or Exclude the covariate value in (from) the output.
•Selection Rule: rule to use to extract data from the dataset.
Dynamically Pick Closest: Pick the test value that is closest to the PC sample collection time. If a Tolerance Interval is specified, the closest value must occur within the specified tolerance window or no value is returned.
Dynamically Pick Next: Pick the test value that occurred after the PC sample collection time. If a Tolerance Interval is specified, the next value must occur within the specified tolerance window or no value will be returned.
Dynamically Pick Previous: Pick the test value that occurred prior to the PC sample collection time. If a Tolerance Interval is specified, the prior value must occur within the specified tolerance window or no value will be returned.
Fixed Baseline: Use the first value marked as a baseline value.
Fixed Pick First: Pick the first value for the test, based on the collection time.
Fixed Pick Last: Pick the last value for the test, based on the collection time.
Fixed Pick Mean: Calculate the Mean of all numeric results for the test, regardless of time collected.
Fixed Pick Median: Calculate the Median of all numeric results for the test, regardless of time collected.
•Tolerance Interval: The allowed tolerance in the covariate value.
•Result: The result column to include for each covariate (select All to include all of the results columns).
Dose: Worksheet containing:
•USUBJID
•Selected Demographics, Pivot, Dose, Dose Unit, Carry to Dose Dataset, and Join columns
•Calculated Relative_Actual_Time and Relative_Nominal_Time
Sample: Worksheet containing:
•USUBJID
•All columns selected as Include in the PK Findings tab and all columns selected for joining to the EX domain
•A result column and result unit column for each pivoted test (each result column is named as the concatenation of the Test Identifier and the Result column name)
•LLOQ value for each pivoted test and PCSEQ value for each pivoted test in the PK Findings domain
•A new result column for PCORRES and PCRSTRSN for each unique unit found in the source dataset for stacked tests
•Additional result columns for the attributes associated with the stacked values: PCORRESU, PCRSTRSU, PCLLOQ, and PCSEQ for stacked results
•All columns from the EX domain that were selected as Include in Sample Dataset
•All demographics selected as Demographic in the DM domain
•Additional calculated time values for Relative_Actual_Time, Relative_Actual_End_Time, and Relative_Nominal_Time
If a single unit is found for all occurrences in a column, the unit is displayed in the column header.
Log: Text file containing a list of step performed during processing.
Settings: Text file containing the mapping selections and test selections made by the user and applied when processing the data.
