•Change graph name and tick labels
•Change outlier style and color
Customization is also available for the following:
•Axis
In the Box plot, the dashed line is the median; the solid line is the arithmetic mean. The ends of the “box” are the 25th and 75th percentiles. These are also referred to as the first and third quartiles. The whiskers show the lowest data value still within 1.5 IQR of the lower quartile, and the highest value still within 1.5 IQR of the upper quartile, where IQR is the interquartile range (the difference between the third and first quartiles, the middle 50%). Custom Whisker IQR factor option in the Content tab allows the user to change the multiplier of IQR to a value other than 1.5.
Data values that do not fall between the whiskers are plotted as outliers (markers outside of the whiskers). Profiles with fewer than five data points plot the data points directly with no box.
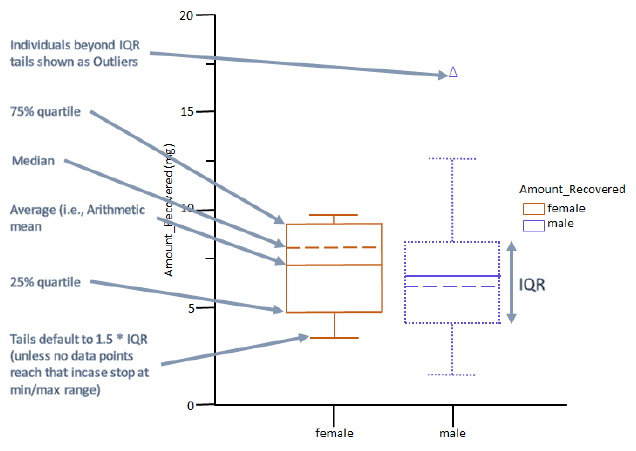
Interpreting a box plot with whiskers
Change graph name and tick labels
-
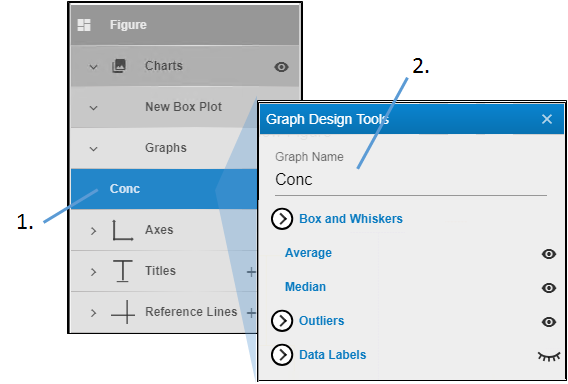
Under the Graphs heading, double-click the graph name.
-
In the Graph Design Tools popup, enter the name in the Graph Name field.
If you click the Average link, you can toggle display of the line indicating the average value of the data in the box plot.
Similarly, if clicking the Median link toggles display of the line indicating the median value of the data in the box plot.
-
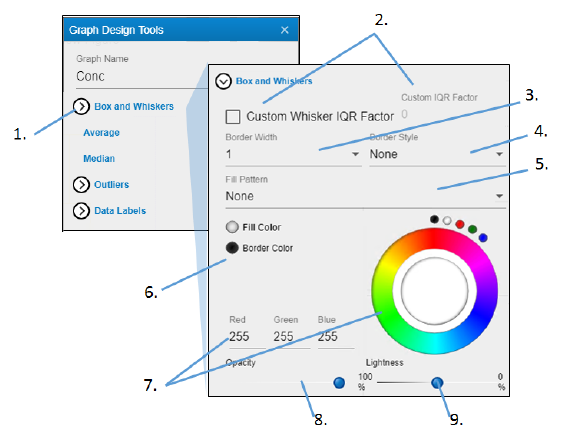
Click Box and Whiskers to view the settings.
-
Check the Custom Whisker IQR Factor box and enter the custom value in the Custom IQR Factor field.
The value is used as a multiplier to determine how far to extend both the top and bottom whiskers (i.e., the InterQuartile Range). -
Enter the thickness for the outline of the box and whiskers in the Border Width field.
-
Use the Border Style pulldown menu to choose the style for the outline (None displays a solid line).
-
Use the Fill Pattern pulldown menu to select a pattern for filling the box portion of the box and whiskers.
-
Select the radio button of the item to change.
-
Click in the color wheel to select a color (or you can click one of the smaller circles to choose a more standard color). Alternatively, enter the RGB value for the desired color in the Red, Green, and Blue fields.
-
Adjust the Opacity of the color by moving the ball along the line. The farther to the right, the more solid the color, the farther to the left, the more transparent.
-
Adjust the Lightness of the color by moving the ball along the line. The farther to the right, the more white is mixed with the color, the farther to the left, the more black is mixed with color.
Change outlier style and color
-
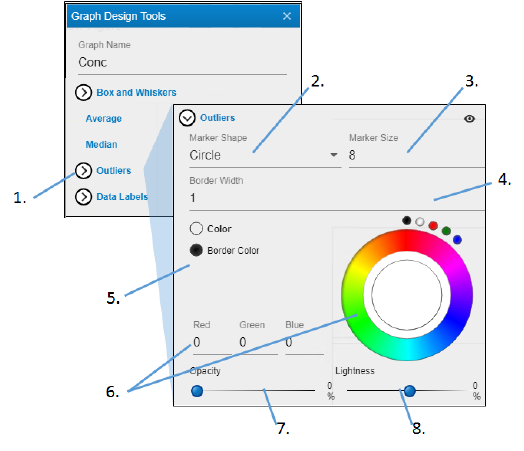
Click Outliers to view the settings.
-
Select the shape for the outlier markers from the Marker Shape pulldown.
-
Select the size of the marker from the Marker Size pulldown.
-
Select the width for the border around the marker from the Border Width pulldown.
-
Select the radio button of the item to change.
-
Click in the color wheel to select a color (or you can click one of the smaller circles to choose a more standard color). Alternatively, enter the RGB value for the desired color in the Red, Green, and Blue fields.
-
Adjust the Opacity of the color by moving the ball along the line. The farther to the right, the more solid the color, the farther to the left, the more transparent.
-
Adjust the Lightness of the color by moving the ball along the line. The farther to the right, the more white is mixed with the color, the farther to the left, the more black is mixed with color.
-
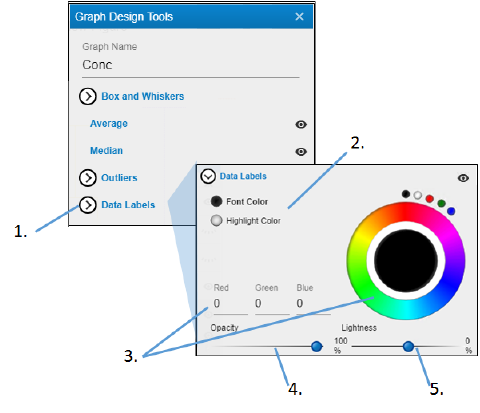
Click Data Labels to view the settings.
-
Select the radio button of the item to change.
-
Click in the color wheel to select a color (or you can click one of the smaller circles to choose a more standard color). Alternatively, enter the RGB value for the desired color in the Red, Green, and Blue fields.
-
Adjust the Opacity of the color by moving the ball along the line. The farther to the right, the more solid the color, the farther to the left, the more transparent.
-
Adjust the Lightness of the color by moving the ball along the line. The farther to the right, the more white is mixed with the color, the farther to the left, the more black is mixed with color.
