•Change label format and alignment
•Change grid line style and color
Customization of axes is available for Area graphs, Box plots, Categorical graphs, Histograms, Horizontal bar graphs, QQ graphs, Vertical bar graphs, and XY graphs.
If you only need to edit the text of the axis label, click on the label in the display area and make the edits.
If you need to change the border or format as well, expand the Axes heading, double-click the axis name, and use the tools in the Axis Design Tools popup as described in the next few sections.
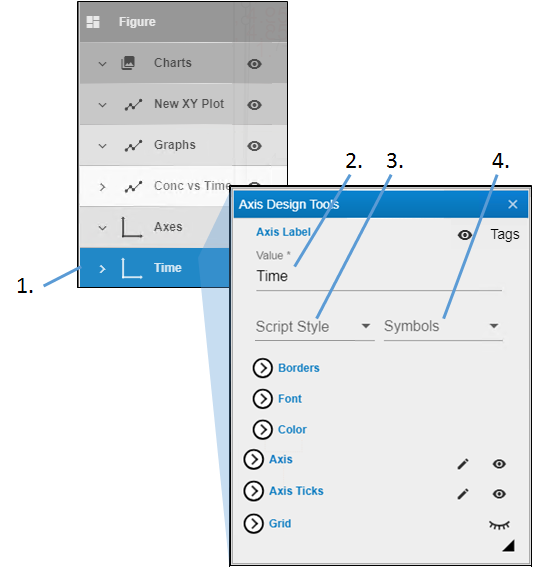
-
Expand the Axes heading and double-click the name of the axis.
-
In the Axis Design Tools popup, edit the name in the Value field.
-
Use the ScriptStyle pulldown menu to enter or change selected characters to superscript or subscript.
-
Use the Symbols pulldown to select a symbol to add or replace selected characters with.
Note:For Histograms, XY, QQ, and Area graphs, you will see additional options for scaling the axis. See “Change axis scale or range” for more information.
Default axis labels for a new graph are strictly text that match the mapped field and any associated units at the time of the graph’s creation. This is different than setting an axis label tag (see “Use tags in labels”). When an axis label tag is set in the Axis Designer Tools, any changes to name of the mapped field or associated units will automatically be picked up on re-execution of the figure. (Any custom text added around the label syntax in the tag will remain unchanged.)
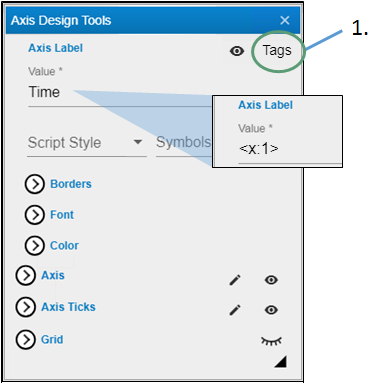
-
Click the Tags icon to enter place holder text into the label, which Phoenix will replace with the mapped value. The place holder labels are:
<x:#> for the x column names
<xunit:#> for the x column units
<y:#> for the y column names
<yunit:#> for the y column units
The # is replaced by the number corresponding to the graph (generally one unless there are multiple graphs overlaid).
Borders can be defined to outline the characters in the label or around the entire label (i.e., a background border).
Tip: You may want to set up the colors and opacity for your borders first, otherwise, they may not be visible when you change the settings here.
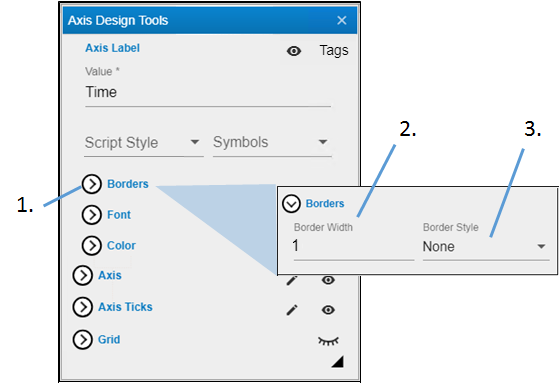
-
Click Borders to view the settings.
-
Enter the thickness for the outline of the characters in the Border Width field.
-
Use the Border Style pulldown menu to choose the style for the outline (None displays a solid line).
Change label format and alignment
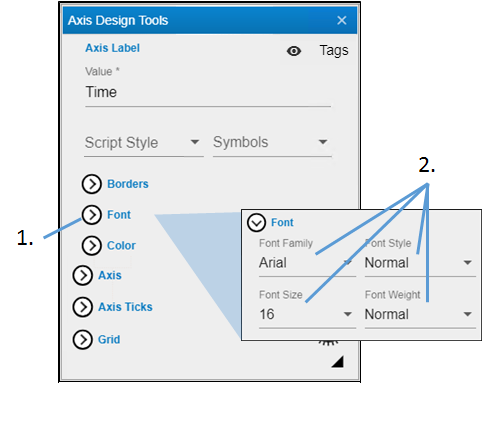
-
Click Font to view the settings.
-
Use the pulldown menus to set the family, size, style, and weight of the label font.
-
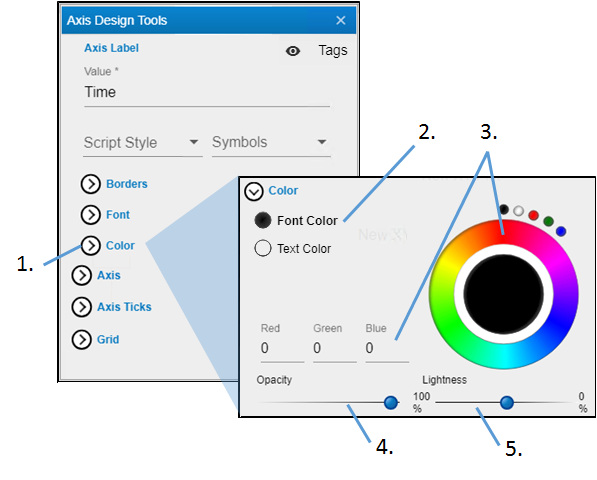
Click Color to view the settings.
-
Select the radio button of the item to change.
-
Click in the color wheel to select a color (or you can click one of the smaller circles to choose a more standard color). Alternatively, enter the RGB value for the desired color in the Red, Green, and Blue fields.
-
Adjust the Opacity of the color by moving the ball along the line. The farther to the right, the more solid the color, the farther to the left, the more transparent.
-
Adjust the Lightness of the color by moving the ball along the line. The farther to the right, the more white is mixed with the color, the farther to the left, the more black is mixed with color.
Axis scale or range adjustments are available for Area graphs, Box plots, Categorical graphs (Y-axis only), Histograms, Horizontal bar graphs (X-axis only), QQ graphs, Vertical bar graphs (Y-axis only), and XY graphs.
-
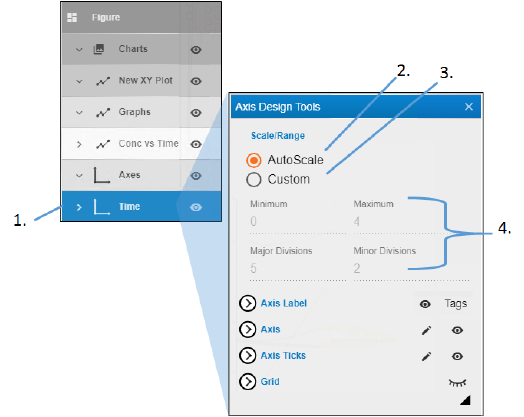
Expand the Axes heading and double-click the name of the axis.
-
In the Axis Design Tools popup, choose the AutoScale radio button to allow Phoenix to determine the best axis scale based on the number of data points and the values used to create each individual plot.
-
Choose Custom to enter the range and increments for the axis.
Type the starting point (i.e., the lowest value on the axis) in the Minimum field.
Type the end point (i.e., highest value on the axis) in the Maximum field.
Type the number of numerically-labeled tick marks to display on the axis in the Major Divisions field.
Type the number of unlabeled tick marks to display on the axis in the Minor Divisions field.
Or
-
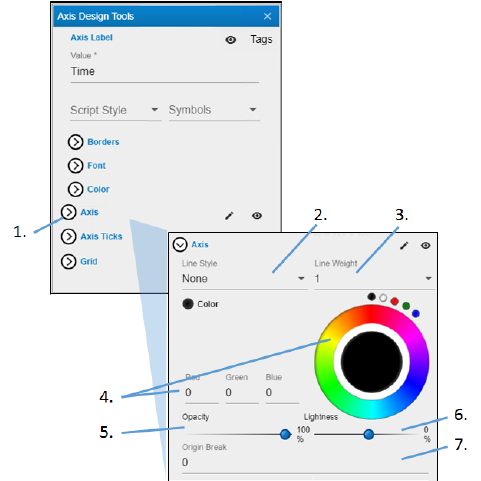
Click Axis to view the settings.
-
Use the Line Style pulldown menu to choose the style for the axis line (None displays a solid line).
-
Enter the thickness for the line in the Line Weight field.
-
Click in the color wheel to select a color (or you can click one of the smaller circles to choose a more standard color). Alternatively, enter the RGB value for the desired color in the Red, Green, and Blue fields.
-
Adjust the Opacity of the color by moving the ball along the line. The farther to the right, the more solid the color, the farther to the left, the more transparent.
-
Adjust the Lightness of the color by moving the ball along the line. The farther to the right, the more white is mixed with the color, the farther to the left, the more black is mixed with color.
-
Use the Origin Break field to specify the space between the Y-axis origin and the X-axis origin.
A negative number moves the X-axis origin to the left of the Y-axis, a positive value moves it to the right.
Change grid line style and color
-
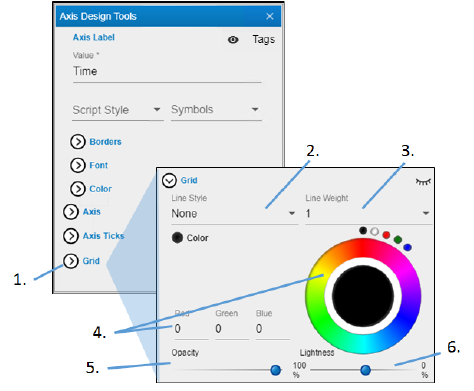
Click Grid to view the settings.
-
Use the Line Style pulldown menu to choose the style for the grid lines (None displays a solid line).
-
Enter the thickness for the lines in the Line Weight field.
-
Click in the color wheel to select a color (or you can click one of the smaller circles to choose a more standard color). Alternatively, enter the RGB value for the desired color in the Red, Green, and Blue fields.
-
Adjust the Opacity of the color by moving the ball along the line. The farther to the right, the more solid the color, the farther to the left, the more transparent.
-
Adjust the Lightness of the color by moving the ball along the line. The farther to the right, the more white is mixed with the color, the farther to the left, the more black is mixed with color.
The Order option is only available for the X-axis in Categorical graphs, Vertical bar graphs, and Horizontal bar graphs.
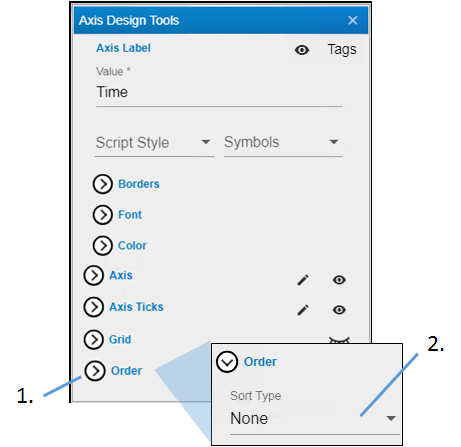
-
Click Order to view the settings.
-
Use the Sort Type pulldown menu to choose how the X-axis values should be ordered.
