Latticing data is a way of arranging a chart display based on a sort key. For example, if a dataset contains columns for subjects, time of dose, and concentration, it is possible to create a chart that displays time versus concentration for each subject if subject is selected as a sort key.

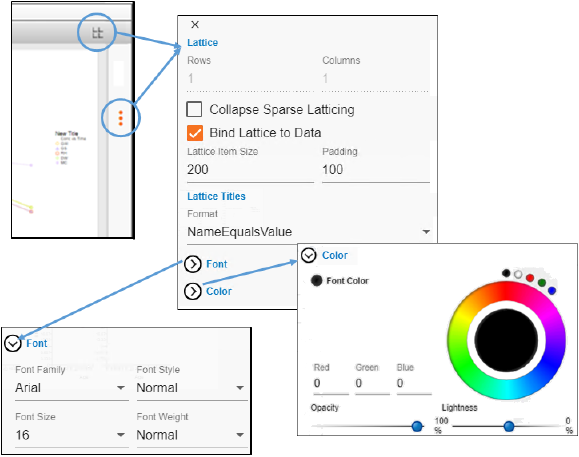
Click ![]() in the panel toolbar or click three red dots on the right side of the panel to show the Layout options.
in the panel toolbar or click three red dots on the right side of the panel to show the Layout options.
Customization of the lattice is available for Area graphs, Box plots, Categorical graphs, Histograms, Horizontal bar graphs, QQ graphs, Vertical bar graphs, and XY graphs.

-
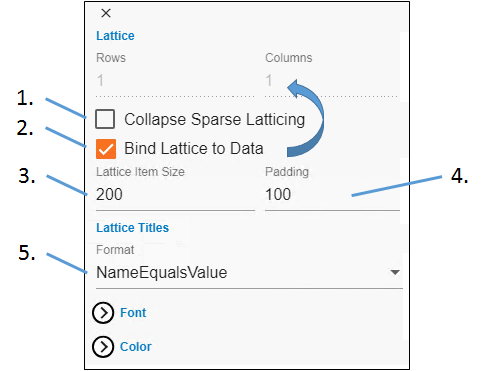
Check the Collapse Sparse Latticing box to remove empty plots.
If multiple variables are mapped to lattice conditions and one variable does not contain as many data points as the others, some empty plots are created. Complete plots are only created when all variables mapped to lattice conditions contain the same number of values. Selecting the Collapse Sparse Latticing checkbox removes the empty plots. -
Clear the Bind Lattice to Data checkbox to enable editing of the Rows and Columns fields in order to specify the rows and columns of the lattice.
In the Rows field, type the number of rows to use in the latticing.
In the Columns field, type the number of columns to use in the latticing. -
In the Lattice Item Size field, specify the height/width of each chart.
-
In the Padding field, specify the distances between charts.
-
From the Format pulldown, select a format for the chart titles. You can choose to show the variable name, or the variable value, or both in the format “Name=Value,” or not to display a title.

-
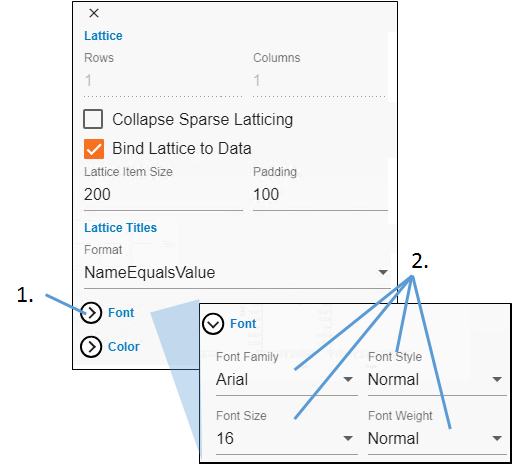
Click Font to view the settings.
-
Use the pulldown menus to set the family, size, style, and weight of the label font.
-
Click the desired alignment of the label. This only affects the alignment of the label text within the label background area, not the display area.

-
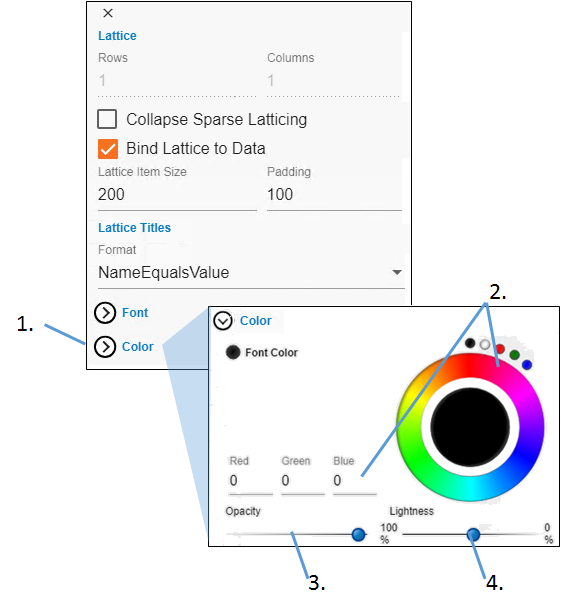
Click Color to view the settings.
-
Click in the color wheel to select a color (or you can click one of the smaller circles to choose a more standard color). Alternatively, enter the RGB value for the desired color in the Red, Green, and Blue fields.
-
Adjust the Opacity of the color by moving the ball along the line. The farther to the right, the more solid the color, the farther to the left, the more transparent.
-
Adjust the Lightness of the color by moving the ball along the line. The farther to the right, the more white is mixed with the color, the farther to the left, the more black is mixed with color.
