The customization options available for major and minor tick marks along an axis are exactly the same. Therefore, the information presented in this section applies to both major and minor tick marks.
Customization of ticks is available for Area graphs, Box plots, Categorical graphs, Histograms, Horizontal bar graphs, QQ graphs, Vertical bar graphs, and XY graphs.

-
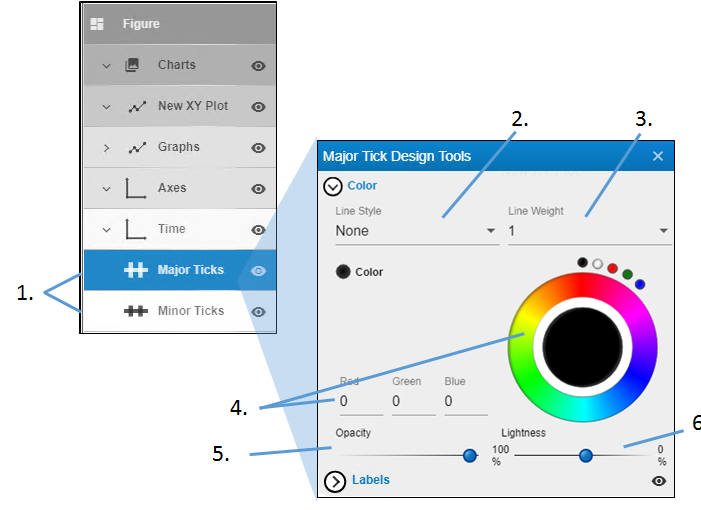
Double-click Major Ticks or Minor Ticks to view the settings.
-
Use the Line Style pulldown menu to choose the style for the tick lines (None displays a solid line).
-
Enter the thickness for the lines in the Line Weight field.
-
Click in the color wheel to select a color (or you can click one of the smaller circles to choose a more standard color). Alternatively, enter the RGB value for the desired color in the Red, Green, and Blue fields.
-
Adjust the Opacity of the color by moving the ball along the line. The farther to the right, the more solid the color, the farther to the left, the more transparent.
-
Adjust the Lightness of the color by moving the ball along the line. The farther to the right, the more white is mixed with the color, the farther to the left, the more black is mixed with color.

-
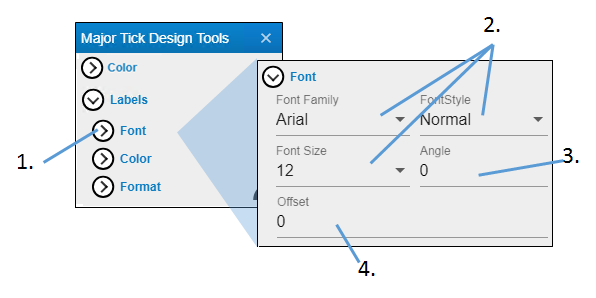
Click Font to view the settings.
-
Use the pulldown menus to set the family, style, and size of the label font.
-
In the Angle field enter how far to rotate the tick labels (in degrees). The range of valid angle values is from –90 to 90.
-
In the Offset field, enter how far to shift the label down from the tick mark.

-
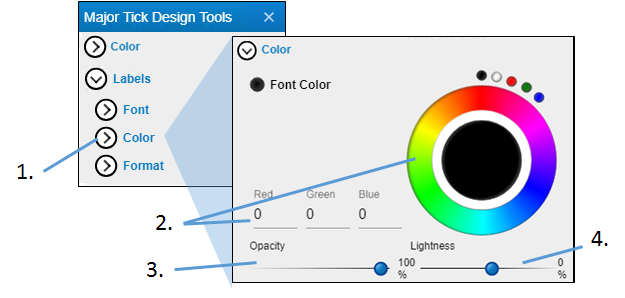
Click Color to view the settings.
-
Click in the color wheel to select a color (or you can click one of the smaller circles to choose a more standard color). Alternatively, enter the RGB value for the desired color in the Red, Green, and Blue fields.
-
Adjust the Opacity of the color by moving the ball along the line. The farther to the right, the more solid the color, the farther to the left, the more transparent.
-
Adjust the Lightness of the color by moving the ball along the line. The farther to the right, the more white is mixed with the color, the farther to the left, the more black is mixed with color.

-
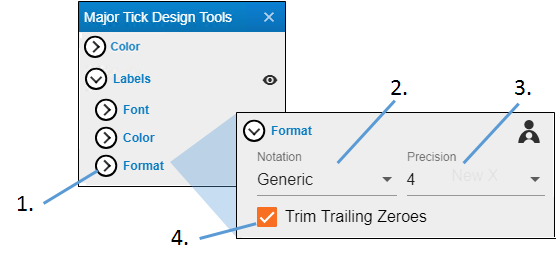
Click Format to view the settings.
-
Use the Notation pulldown to specify how numeric values are to be displayed:
Generic: Fixed point or scientific notation, whichever is more compact
Fixed point: Integral and decimal digits
Exponent: Scientific notation
Decimal: Integer digits
Percents: Multiply by 100 and add a percent symbol -
From the Precision pulldown, set the number of decimal digits or the number of significant figures to display, depending on the Notation setting.
-
Check the Trim Trailing Zeroes check box to remove any zeroes at the end of a label that are not significant figures.
