The Data Wizard is designed to facilitate repeated data operations on the same dataset. It also allows changes in the sequence of the operations. It replaces the following standalone tools: Column Properties, Filter Worksheet, and Column Transformation. (If a project created in an earlier version of Phoenix has those options, these objects are loaded and visible.) The Data Wizard provides the property computing, filtering, and transformation operations as well as generating an easy summary worksheet to keep the workflow organized.
Use one of the following to add a Data Wizard object to a Workflow:
Right-click menu for a Workflow object: New > Data > Data Wizard.
Or Main menu: Insert > Data > Data Wizard.
Or right-click menu for a worksheet: Send To > Data > Data Wizard.
The manipulation of data is defined in the Data Wizard as Steps. When the Data Wizard object is added, Step 1 is automatically listed in the Summary list of the Setup tab and is ready to be defined. From the Action menu in the Options tab, select Properties, Filter or Transformation and press Add to define the step.
Once that selection is made, the action is appended to the Step name in the Summary list and other controls on the Options tab are enabled appropriately.
A series of steps can easily be created (specifying column properties via Properties, filtering the data using Filter, and then doing a data transformation using Transformation). Each step in the Data Wizard identifies its action in the Summary. Delete steps, rearrange steps, insert new steps, and specify when to execute steps in a sequence using the buttons in the Options tab.
The first step in the Data Wizard allows the user to map the dataset, whether it is for filtering, transformation, or modifying column properties. After the dataset has been mapped in that first step, all subsequent steps use that source dataset in combination with the steps created in the Data Wizard.
The Retain Intermediate Results checkbox preserves all results for each step set up in the Data Wizard. It will add significantly to the amount of output (and requires more memory). This options is only recommended when the intermediate output is truly necessary.
This section contains information about the following:
See also “Ratios and baseline adjustments example”.
Note:To view the object in its own window, select it in the Object Browser and double-click it or press ENTER. All instructions for setting up and execution are the same whether the object is viewed in its own window or in Phoenix view.
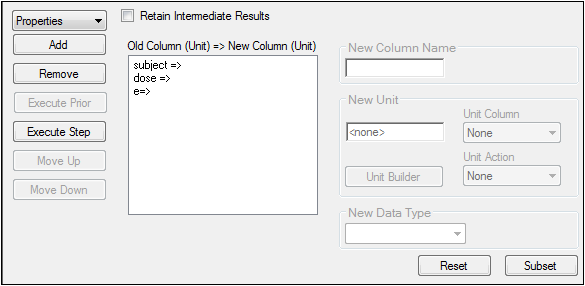
The Properties operation in the Data Wizard allows users to set column header names, units, and data types (text or numeric) for worksheets.
The interface consists of three main parts:
Main Mappings panel
Options tab
Defaults tab
Users must map a dataset to the Main Mappings panel when the first step is set up. All subsequent steps will automatically be mapped to the same dataset.
None: Columns mapped to this context are simply included in the output.
Sort: Sort variables used to define individual profiles.
The Options tab lists all the column headers in a worksheet and any associated units. The column headers and units are displayed in the columns list in the Options tab.
To change column header properties:
-
Select a column header in the columns list to change its properties.
-
In the New Column Name field, type a new column header name.
Phoenix does not allow spaces in column headers and will substitute an underscore (_) for a space.
A column name can only consist of alphanumeric characters and underscores, and cannot start with a number.
The constraints on column names exist because spaces and other characters in column names can cause filter and sort functions to not work correctly. -
In the New Unit field, type a new unit for the new column.
Alternatively, click Units Builder to use the Units Builder dialog to change column units. The Units Builder can be used to specify new units or convert existing units. -
In the Unit Action list, select the action desired: Specifying the unit or Converting units.
See “Using the Units Builder” for more details on this tool.
Each column in a worksheet can use different units. The units are displayed in parentheses in the column header, and can be used in calculations. If the units are not standard or recognizable, Phoenix displays them in braces: {mmHg}. Nonstandard units are carried throughout any operations but are not used in any calculations. Unit types and Unit Prefixes list standard units and prefixes.
Caution:If it is possible, units are automatically converted when the new column unit does not match the old column unit. Make sure the old and new column units match if unit conversion is not necessary or wanted.
-
In the New Data Type menu, select Text or Numeric to change the data type of the selected column.
Changing a column from text to numeric deletes any non-numeric values in the column. Changing a column from numeric to text does not delete any values.
Data type refers to column data types. There are two kinds, numeric and text. Numeric columns contain only numeric values, and Phoenix treats the values in a numeric column as numeric data.Text, or string-type, columns can contain mixed numeric and text values, but Phoenix treats values in a text column as non-numeric values that cannot have certain operations performed on them, such as an arithmetic transformation. -
Select another column header in the columns list to change its properties.
|
Prefix |
Abbreviation |
|
Prefix |
Abbreviation |
|
femto |
f |
|
milli |
m |
|
pico |
p |
centi |
c |
|
|
nano |
n |
deci |
d |
|
|
micro |
u |
deca |
dk |
|
|
|
|
kilo |
k |
The Defaults tab is used to automatically change column properties. Users can specify new column names and units for common columns like Time or Concentration.
Caution:Defaults must be specified before a worksheet is mapped in the Properties operation.
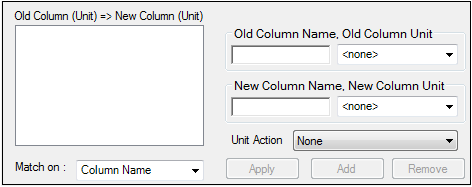
Properties Defaults tab
When a worksheet is mapped to a Properties operation that has defaults set, any matching column headers and units are automatically changed or converted.
Defaults are listed on the default columns box.
To add new defaults
Type the column header name to be automatically converted in the Old Column Name field.
Select a unit, if applicable, in the Old Column Unit menu.
Type a new column name in the New Column Name field.
Select a new unit, if applicable, in the New Column Unit menu.
Caution:If it is possible, units are automatically converted if the new column unit does not match the old column unit. Make sure the old and new column units match if unit conversion is not necessary or wanted.
Click Add to add the new column header default to the default columns box.
The default column name can be edited after it is added.
Make any changes in the column name field and column units menus, and click the Apply button to apply the changes.
In the Match on menu, select whether or not to match the default column to input worksheet columns based on column name or column name and unit.
Select a default in the default columns box and click Remove to remove the column default.
Add another default by typing another column header name in the Old Column Name field and repeating the previous instructions.
The Transformation operation creates a new column in a worksheet that is the result of a transformation. Phoenix supports arithmetic, baseline, custom, and function transformations. All data in the source column are transformed regardless of exclusions, which are carried over to the new column.
The Transformation user interface consists of two main parts, the Setup tab and the Options tab.
Main Mappings panel
Options tab
Users must map a dataset to the Main Mappings panel when the first step is set up. All subsequent steps will automatically be mapped to the same dataset. Required input will be highlighted orange in the interface.
Users can select to assign the units of an input (mapped) column to a new column created via a transformation. If the Output Column Unit selection is mapped, the column mapped to that context will have its unit used in the new output column.
Context associations for a Transformation object change depending on which transformation type is selected in the Options tab.
Arithmetic transformation mappings
None: Columns mapped to this context are simply included in the output.
x Column and y Column: Columns in a worksheet used in an arithmetic transformation.
Output Columns:
None: Units of columns mapped to this context are not used in the new output column.
Unit: The column whose units are to be used in the new output column.
Baseline transformation mappings
None: Columns mapped to this context are simply included in the output.
x Column: The independent variable that is used to compute the baseline values.
Sort: Sort variable(s) used to define individual profiles.
Time: Time values that are used to compute the baseline values.
Output Column:
None: Units of columns mapped to this context are not used in the new output column.
Unit: The column whose units are to be used in the new output column
Custom transformation mappings
Output Column:
None: Units of columns mapped to this context are not used in the new output column.
Unit: The column whose units are to be used in the new output column.
Other mapping contexts are defined in the Formula field.
Function transformation mappings
None: Columns mapped to this context are simply included in the output.
x Column: The independent variable that is used to provide the values for the function transformations.
Output Column:
None: Units of columns mapped to this context are not used in the new output column.
Unit: The column whose units are to be used in the new output column.
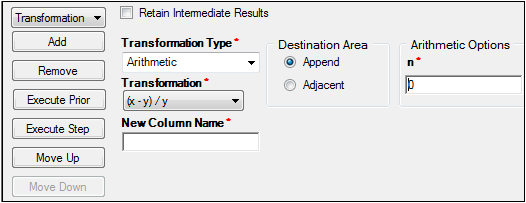
The Options tab is used to select the transformation type and specify options for each transformation type. The Options tab also allows users to specify the sequence of the operations in the Data Wizard.
|
Arithmetic |
Baseline |
Custom |
Functions |
|
(x – y)/y |
% Change from Baseline |
Custom Function |
1/x |
|
(x + y)/y*100 |
Change from Baseline |
Absolute value(x) |
|
|
x – n |
Ratio from Baseline |
e^x |
|
|
x – y |
|
LN(x) |
|
|
x*n |
Log10(x) |
||
|
x*y |
Square root(x) |
||
|
x/n |
|
||
|
x/y |
|||
|
x^n |
|||
|
x^y |
|||
|
x + n |
|||
|
x + y |
In the Arithmetic and Functions options, x and y are columns in a worksheet, in the Arithmetic options, n is a number, and in the Functions options e is the base of the natural logarithm (2.718281828).
Note:For custom transformations with arithmetic operations, blank cells are treated as zero.
In the Transformation Type menu, select one of four transformations: Arithmetic, Baseline, Custom, Functions.
In the Transformation Type menu, select Arithmetic.
In the Transformation menu, select the arithmetic transformation type.
If one of the x and y transformations are selected, the x Column and y Column mapping contexts are made available in the Main Mappings panel.
Use the option buttons to map data types in the worksheet to the x Column and y Column contexts. If one of the x and n transformations are selected, then a value for n must be specified.
In the Arithmetic Options field, type a value for n.
In the New Column Name field, type a name for the column used to contain the transformed values.
In the Destination Area, select one of the option buttons.
Append places the new column after the last column in the dataset.
Adjacent places the new column to the right of the data type mapped to the x Column context.
Users can choose whether to specify sort variables for baseline transformations. Sort variables define unique profiles that are used to compute change from baseline separately for each profile. Typically, a single variable representing subject IDs is sufficient. Other data may require more than one variable, such as Subject and Period. The baseline transformation sorts the output worksheet in alphabetical or numerical order, based on the sort variables.
Rules for using datasets in a baseline transformation:
By default, Phoenix uses the value corresponding to time=0 as the baseline for each unique profile. If a profile has more than one value at time zero, Phoenix uses the first value as the baseline.
If a zero time value is not in the dataset, the time value to use for the baseline value (normally the lowest time) must be specified, or the user must choose to use the minimum time for each group, in order to generate the baseline transformations.
Enter the lowest (or other) time value in the Fixed Value field or
Select MinimumPerGroup in the Starting Point dropdown menu.
If the columns mapped to x Column has a zero or missing value at the time specified for the baseline, then the % Change from Baseline and Ratio from Baseline options will produce empty results. An alternate baseline time value or the MinimumPerGroup option may be used.
To create a baseline transformation
In the Transformation Type menu, select Baseline.
In the Transformation menu, select the baseline transformation type.
If % Change from Baseline is selected, Phoenix performs a transformation on a column by calculating the percent change between each value and either a fixed baseline value or the minimum value for each distinct profile.
result=(x – baseline)/baseline*100
If Change from Baseline is selected, Phoenix performs a transformation on a column by calculating the change between each value and either a fixed baseline value or the minimum value for each distinct profile.
result=x – baseline
If Ratio from Baseline is selected, Phoenix performs a transformation on a column by determining the ratio to either a fixed baseline value or the minimum value from each distinct profile.
result=x/baseline
In the Main Mappings panel, click the option buttons to specify the x Column, the Sort column(s), and the Time column.
Users can map multiple or no columns in a worksheet to the Sort context. Each column mapped to the Sort context creates a unique profile. Baselines are calculated on a per profile basis.
In the New Column Name field, type a name for the column that will contain the transformed values.
In the Starting Point menu, select Fixed Point or Minimum per Group.
If Minimum per Group is selected, the lowest time point in each profile is used to generate the baseline transformation. Selecting this option means that the baseline transformation uses a different starting point for each profile defined by the sort key(s).
If Fixed Point is selected, users can enter custom starting time value in the Fixed Value field.
In the Fixed Value field, type a time value for a time column in Numeric format or in Text format.
If a time column is in Text format, users must type fixed time value in the same format used to enter the time values in the worksheet. For example, if the first time point used as the baseline is 1:00, then 1:00 must be typed in the Fixed Value column. For acceptable dates and times in Text format, see “Date and time formats”.
The default is zero, because Phoenix, by default, evaluates the change from baseline at time=0. If a value is entered that is higher than the highest time value, then no output values are produced in the new column.
In the Treat Time Values as menu, select the format used by the time column.
Numeric Format means the Time column is in Numeric format.
Date\Time Format means the Time column is in Text format. If selected, the Time Units menu is made available. The selected units are applied to the transformed time column, and are converted if they do not match the source time column units.
In the Time Units menu, select the units to use in the transformed time column.
If Date\Time Format is selected, the Create Transformed Time Column checkbox is made available.
Check the Create Transformed Time Column box to create a Numeric time column in the output that is based on the values in a Text time column or clear the checkbox to not create a transformed time column.
In the Destination Area, select one of the option buttons.
Append places the new column after the last column in the dataset.
Adjacent places the new column to the right of the data type mapped to the x Column context.
Users can create a custom transformation that transforms one or more columns in a worksheet using the functions provided by Phoenix.
To create a custom transformation
In the Transformation Type menu, select Custom.
Custom Function is selected by default in the Transformation menu. There are no other options in the menu for custom functions.
In the New Column Name field, type a name for the column that will contain the transformed values.
In the Formula field, type a custom function or use the pointer to select a function name in the Function List and drag the function name to the Formula field.
Custom functions can be defined, edited, and combined in the Formula field. The if custom function allows users to create a compound function using the logical operators & (and) and | (or). For example, if((col1=1) & (col2=2), 1, 0). Each condition in the if statement must be placed in parentheses. Be careful with spaces when entering the formulas, as unexpected spaces can cause the mapping panel to not display properly.
See “Example custom functions” for a list of all possible functions and examples of how to use them. The same information is also listed in the Function List in the Options tab.
In the Main Mappings panel, click the option buttons to specify the mapping contexts created by the custom function.
To find the absolute value, logarithmic values, or square root
In the Transformation Type menu, select Functions.
In the Transformation menu, select the function transformation type.
Use the option buttons to map a column in the worksheet to the x Column context.
In the New Column Name field, type a name for the column used to contain the transformed values.
In the Destination Area, select one of the option buttons.
Append places the new column after the last column in the dataset.
Adjacent places the new column to the right of the data type mapped to the x Column context.
Note:Using the Data Wizard, it is easy to create a sequence of operations, whether transformations or combinations of the other Wizard operations.
Below are some common functions that may be helpful.
|
Formula |
Description |
|
substitute(conc,”BQL”,0.1,0) |
Look in the mapped column conc and, if you find a value of a cell equal to BQL, substitute it for a 0.1 in the new column. |
|
substitute(CobsPop, 0.1,"BQL",0) |
Look in the mapped column CobsPop and, if you find a value of a cell equal to 0.1, substitute it for a BQL in the new column. |
|
if(CobsPop==0.01, 1, 0) or; |
If any cell in the mapped column CobsPop is equal to 0.1, then enter a 1 in the new column, otherwise enter a 0. |
|
if(CobsPop = 0.01, 1, 0) |
If any cell in the mapped column CobsPop is equal to 0.1, then enter a 1 in the new column. |
|
if(CobsPop = 0.1, 1, if(CobsPop < 1, 2, 0)) |
Embedded ifs. |
|
if(CobsPop = 0.1, 1, if(id==1, 2, 0)) |
Embedded ifs with different vars. |
|
replace(conc,2,2,"LQ") |
Look in the mapped column conc and replace starting at number 2 position string with 2 letters LQ. |
|
Ln(conc) |
Write the natural log of the value in the mapped column conc in the new column. |
|
Name |
Description |
Example |
|
abs |
Returns the absolute value of the supplied parameter. |
abs(–12)=12; |
|
acos |
Returns the inverse cosine of parameter1. |
acos(–0.5)=2.094395 |
|
acosh |
Calculates the inverse hyperbolic cosine of parameter1. |
acosh(10)=2.99322 |
|
asin |
Calculates the inverse sine of parameter1. |
asin(–0.5)= –0.5236 |
|
asinh |
Calculates the inverse hyperbolic sine of parameter1. |
asinh(–2.5)= –1.6472311 |
|
atan |
Calculates the inverse tangent of parameter1. |
atan(1)=0.785398 |
|
atan2 |
Calculates the arc tangent of two coordinates. |
atan2(x coord, y coord); |
|
atanh |
Calculates the inverse hyperbolic tangent of a value. |
atanh(0.76159416)=1 |
|
average |
Returns the average of the supplied parameters. |
average(A1:A10); |
|
ceiling |
Returns the smallest integer value greater than, but not equal to, the value supplied. |
ceiling(12.5) |
|
chiinv |
Calculates the inverse chi-square distribution |
chiinv(p, df) |
|
clean |
Cleans text of non-printable characters. |
clean(“string with non-printable chars”); |
|
concatenate |
Combines two or more strings into one string. |
concatenate(A1:A5); |
|
cos |
Calculates the cosine of parameter1. |
cos(1.047)=0.50017107 |
|
cosh |
Calculates the hyperbolic cosine of parameter1. |
cosh(4)=27.30823 |
|
count |
Returns the number of values in a list, including empty cells. |
count(A1:A5) |
|
counta |
Returns the number of non-empty cells in a given range. |
counta(A1:A5) |
|
date |
Returns the sequential serial number that represents a particular date. |
date(2007, 11, 27)=39411 |
|
datevalue |
Uses datetime to return the serial number of the date represented by date_text. |
datevalue(“11/27/2007”)=39411 |
|
day |
Returns the day of a date, represented by a serial number. The day is given as an integer ranging from 1 to 31. |
day(serial_time); |
|
even |
Returns the smallest even integer greater than the argument. |
even(12.1) |
|
exp |
Returns e raised to the power of the supplied parameter. |
exp(3); |
|
fact |
Returns the factorial of the supplied parameter. |
fact(3) |
|
floor |
Returns the largest integer less than the supplied parameter. |
floor(12.9) |
|
format |
Formats a string using .NET string formatting commands. |
format(ColumnA, “G8”); |
|
geomean |
Returns the geometric mean of a range of positive data. |
geomean(A1:A15) |
|
geovar |
Returns the geometric variance of a range of positive data. |
geovar(A1:A15) |
|
harmean |
Returns the harmonic mean of a range of data. |
harmean(A1:B32) |
|
harmvar |
Returns the harmonic variance of a range of data. |
harvar(A1:C33) |
|
hour |
Returns the hour of a time value. The hour is given as an integer, ranging from zero (12:00 A.M.) to 23 (11:00 P.M.). |
hour(serial_time); |
|
if |
Returns true if conditional argument is true; false otherwise. |
if((A1=0.25), 1, 0) |
|
IsNull |
Returns true if value of cell is NULL (empty). |
IsNull(ColumnA) |
|
left |
Returns the specified number of characters (from left to right) of a string. |
left(“This is a test”, 1)=T; |
|
length |
Return the length of a string. |
length(“this is a test”)=14; |
|
ln |
Returns the natural log of the supplied parameter. |
ln(2.3); |
|
log |
Returns the log of the first parameter to the base of the second parameter. |
log(number, base); |
|
log10 |
Returns the log base 10 of the parameter. |
log10(5); |
|
lower |
Returns the supplied string as lower case. |
lower(“This Is A Test”)=“this is a test”; |
|
mid |
Returns a specific number of characters from a string from a given position and length parameters. |
mid(text, start pos, distance); |
|
minute |
Returns the minutes of a time value. The minute is given as an integer, ranging from zero to 59. |
minute(serial_time); |
|
mod |
Returns the remainder after parameter1 is divided by parameter2. |
mod(number, divisor); |
|
month |
Returns the month of a date represented by a serial number. |
month(serial_time); |
|
now |
Returns the current date and time as a double (serial date/time). |
now()=current date |
|
odd |
Returns the smallest odd integer greater than the supplied parameter. |
odd(13.1) |
|
pi |
Returns the value of pi. |
pi() |
|
product |
Returns the product of a list of real numbers. |
product(A1:Z88) |
|
rand |
Returns a random number based on a lower limit, an upper limit, and a seed. |
rand(,); |
|
replace |
Replaces a sub-string with another string. |
replace(text, start pos, distance, replace with); |
|
right |
Returns a specific number of characters from a string starting from the right and moving left. |
right(“This is a test”, 3)=“est” |
|
root |
Returns the root of a parameter1, using parameter2/parameter3. |
x^(a/b); |
|
round |
Rounds parameter1 to the number of decimal places defined by parameter2. |
round(12.345, 2)=12.35; |
|
roundsig |
Rounds parameter1 to the number of significant digits defined by parameter2. |
roundsig(12.234, 3)=12.3 |
|
search |
Returns the one-based starting position of a substring within a larger string. |
search(“Phoenix”, “oe”, 1)=3 |
|
second |
Returns the seconds of a time value. |
second(38711.06302)=44 |
|
sign |
Determines the sign of a number. |
sign(–12); |
|
sin |
Calculates the sine of parameter1. |
sin(1)=0.84147098 |
|
sinh |
Calculates the hyperbolic sine of parameter1. |
sinh(1)=1.175201194 |
|
sqrt |
Returns the square root of parameter1. |
sqrt(9) |
|
stdev |
Estimates standard deviation based on a range of data. |
stdev(A1:C1) |
|
strcmp |
An integer indicating the case sensitive lexical relationship between the two comparands. |
strcmp(stringA, stringB) |
|
substitute |
Substitutes new text for old text in a text string and optionally [for a given instance]. |
substitute(text, target text, replacement text, [instance]); |
|
sum |
Returns the sum of the specified values. |
sum(A1:A12); |
|
sumsq |
Returns the sum of the squares of the arguments. |
sumsq(C1:C33) |
|
tan |
Calculates the tangent of parameter1. |
tan(0.785)=0.99920399 |
|
tanh |
Calculates the hyperbolic tangent of parameter1. |
tanh(–2)= –0.96403 |
|
time |
Returns the decimal number for a particular time. |
time(hour, min, sec); |
|
timevalue |
Uses datetimes to return the decimal number of the time represented by a text string, with precision up to the second. |
timevalue(“2:24 AM”)=0.1 |
|
tinv |
Calculates the inverse t distribution and returns absolute value. |
tinv(p, df); |
|
today |
Returns the serial number of the current date. |
today()=current date as serial time |
|
trim |
Removes all spaces from text except for single spaces between words. |
trim(“ this is a test”)=“this is a test” |
|
trunc |
Truncates a real number to an integer by removing the decimal places. |
trunc(number); |
|
upper |
Returns parameter1 in upper case. |
upper(“this is a test”)=“THIS IS A TEST” |
|
var |
Returns the variance of a set of real numbers. |
var(A1:A5) |
|
weekday |
Returns the day of the week corresponding to a date. |
weekday(serial_time); |
|
year |
Returns the year corresponding to a date. |
year(39411)=2007 |
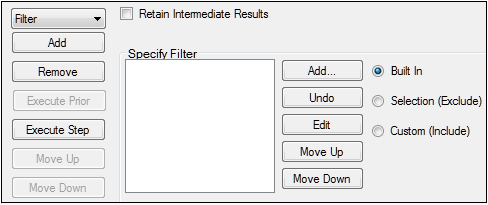
The Filter operation allows users to search for values in a dataset, specify if only matching data are returned (include), if the matches are filtered out (exclude), or replaced with another value. Additional options allow users to choose if the entire dataset is to be searched or just a particular column and if the entire row containing a matching cell is filtered or just the matching cell.
Main Mappings panel
Options tab
Users must map a dataset to the Main Mappings panel when the first step is set up. All subsequent steps will automatically be mapped to the same dataset.
Use the Main Mappings panel to specify which input variables are filtered. Main Mapping input variables to context associations is optional.
None: Columns mapped to this context are simply included in the output.
Exclude: Columns mapped to this context are excluded in the result worksheet.
To specify the type of filter
Select one of the option buttons to choose the filter type.
Built In – Use the Filter Specification dialog to add a filter.
Selection (Exclude) – Use the Filter Selection dialog to exclude part of a dataset.
Custom (Include) – Use the Custom Filter Entry dialog to specify a custom filter.
Click Add to add a filter.
The Specify Filter field lists all added filters. Select a filter to remove, edit, or move it.
Filters are executed in the order they are listed.
Click Undo to remove the last filter created from the list.
Click Edit to edit a filter.
Click Move Up to move a filter to top of the list.
Click Move Down to move a filter to the bottom of the list.
Note:If a User Selection filter is defined and listed in the Specify Filter field, the Move Up/Move Down buttons in the Data Wizard are disabled.
When the Built In option is selected in the Options tab, clicking Add displays the Filter Specification dialog.
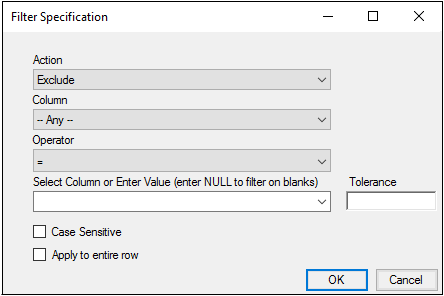
In the Action menu, select a filter action.
Exclude: Filter out cells/rows that match the filter criteria.
Include: Keep only the cells/rows that match the filter criteria.
Replace: For each cell that matches the filter criteria, replace it with a specified value.
From the Column menu, select the column to which the filter criteria is to be applied.
From the Operator menu, select an operator.
|
Operator(s) |
Description |
|
= |
equal to the search string |
|
< |
less than the search string |
|
<= |
less than or equal to the search string |
|
> |
greater than the search string |
|
>= |
greater than or equal to the search string |
Note:To exclude (include) “not equal” values, instead include (exclude) equal values.
Select the name of an existing column from the Select Column or Enter Value pull-down menu to compare its cell values with those in the column chosen in the Column pull-down menu.
Or
Type a value directly into the field to search for that value in the column selected in the Column pull-down menu.
If Exclude or Include is the action, check the Apply to entire row box to exclude/include the entire row when the filter criteria is matched. or clear the checkbox (the default) to exclude or include a cell that matches the criteria.
If Replace is the action:
In the Replace with field, type the value to place in a cell that matches the filter criteria.
Check the Replace All box to replace all instances where the criteria is matched in the specified column (or in all columns if Any is specified). Clear the checkbox to only replace the first match in the specified column (or first match in each column if Any is specified).
Type a value in the Tolerance field to search for values within a range of a numeric search value.
The Tolerance field is only available when a numerical value is entered in the Value field and is used to find values not different from the numeric search value by more than the tolerance value. This function is optional.
Numeric values that are +/- the tolerance of the search value are considered to match the search value. If a non-numerical value is entered in the Find field, then the Case Sensitive checkbox is made available.
Select the Case Sensitive checkbox to search for strings that match the capitalization used in the search string.
Built-in filter rules:
Blank cells can be filtered by using the term ‘NULL’ in the filter expression to represent the blank cells.
Users can filter cells that contain values with leading single quotes by typing an additional single quote before the value in the Filter Specification dialog. For example, to filter a value like ‘000123’, users need to type “000123” in the Custom Filter Entry dialog.
When the Selection (Exclude) option is selected in the Options tab, clicking Add displays the Filter Selection dialog.
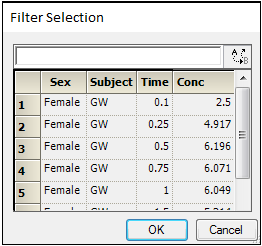
Note:If this table is blank, click Cancel, check the Retain Intermediate Results checkbox in the Options tab, and then click Add. The table will be populated.
Use the pointer to select part or all of a worksheet.
Click OK to exit the Filter Selection dialog, or click Cancel to exit the dialog without excluding the selected cells.
Note:Adding a User Selection filter to the list in the Specify Filter field results in the Move Up/Move Down buttons in the Data Wizard becoming disabled.
This section contains the syntax and some of the codes that can be used to create custom inclusion filters for a worksheet. Any standard SQL syntax can be used. Custom filters are defined in the Custom Filter Entry dialog.
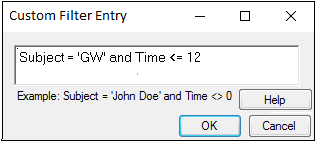
In the Custom Filter Entry dialog, type the custom filter.
Click OK to add the filter or click Cancel to exit the dialog without adding the filter.
Only one filter can be added at a time in the Custom Filter Entry dialog.
Custom filter syntax:
[Column name] [Expression] [Value] [Logical operator][Column name] [Expression] [Value]
Example: Subject='GW' AND Time <= 12
Logic operators:
Statement grouping is done using the Boolean AND, OR, and NOT operators. Use parentheses to group clauses and force precedence. The AND operator has precedence over other operators.
Example: (Subject='JDW' OR Subject='LEJ') AND Conc > 1
When creating comparison expressions, the following operators are allowed:
|
Operator |
Description |
|
= |
Equals |
|
<> |
Not Equals |
|
< |
Less than |
|
<= |
Less than or equal |
|
> |
Greater than |
|
>= |
Greater than or equal |
Custom filter rules:
-
User-defined values can be used in expressions to compare against column values.
Example: Effect <= 75.00 -
String values must be enclosed in single quotes.
Example: Subject='JDW' -
String values and column names are not case sensitive.
-
Date values should be enclosed with pound signs (#).
Example: Date > #12/01/2008# -
Decimals and scientific notation are permitted for numerical values.
-
Blank cells can be filtered by using the term ‘NULL’ in the filter expression to represent the blank cells.
-
A wildcard can be specified by a percent sign with the operator ‘like’.
Example: Analyte like ‘Metabolite%’
Note:Any step in the Data Wizard can be revisited, revised, and re-executed. All of the steps performed are described carefully in the Summary part of the Output.
All of the steps in the Data Wizard generate output. The output forms specific to a particular kind of operation are specified below. In general, each step in the Data Wizard will create the following output:
|
Worksheet |
Content |
|
Result |
The final result of all operations in the step. |
|
Summary |
Listing of all steps in the Data Wizard. |
|
Settings |
The settings used in all steps. |
|
Additional output when intermediate results are retained |
|
|
Final Results |
The Results, Summary, and Settings that represent all steps. |
|
Secondary |
Non-empty intermediate results that are not used in the final results above. |
|
Additional output when intermediate results are retained |
|
|
Final Results |
The Results, Summary, and Settings that represent all steps. |
|
Intermediate Results |
All non-empty intermediate results generated by the steps. |
