Join two worksheets based on a sort key. The object can perform two types of joins: inner and outer. Each one corresponds to inner and outer joins used in SQL (structured query language).
Use one of the following to add an Join Worksheet object to a Workflow:
Right-click menu for a Workflow object: New > Data > Join Worksheet.
Main menu: Insert > Data > Join Worksheet.
Right-click menu for a worksheet: Send To > Data > Join Worksheet.
Note:To view the object in its own window, select it in the Object Browser and double-click it or press ENTER. All instructions for setting up and execution are the same whether the object is viewed in its own window or in Phoenix view.
Additional information is available for the following topics:
The Mappings panel allows users to specify which columns in a worksheet are involved in the worksheet transformation. Required input is highlighted orange in the interface.
Sort: Categorical variable(s) identifying individual data profiles, such as subject ID.
Source Column: The column(s) to append together in a new worksheet.
By default, the Join Worksheets object requires that columns mapped to the Sort context have the same name. The Sort Map panel allows users to mix and match or override column names. For example, if the two columns being merged have different names, such as Subject and ID, the Sort Map panel can be used to specify matching columns in the two worksheets.
|
Worksheet_1 |
Worksheet_2 |
|
Subject |
ID |
|
Conc |
YObs |
In this example, the Subject column in worksheet 1 is joined/merged to the ID column in worksheet 2, and the Conc column in worksheet 1 is joined/merged to the YObs column in worksheet 2.

The default join for the Join Worksheets object is an outer join. Check the Inner Join box to use an inner join to combine the two worksheets. If Inner Join is selected, then the variables or parameters mapped to the Sort context must have the same values in both worksheets.
An inner join requires each value in the two joined worksheets to have a matching value. An inner join combines the values from the two worksheets based on the selected sort keys and source columns. The result of the inner join is created by combining every value in the first worksheet with every value in second worksheet, and then outputting all values which meet the join conditions.
The Join Worksheets object generates one worksheet and one text file.
Result: The joined worksheets.
Settings: Text file containing input worksheets used and the options selected.
Joining raw data and modeling output in tables example
This example shows how to reproduce table template 9 that was used in WinNonlin 5.3 and earlier. Phoenix does not have a specific table type for this template. The main difference between table template 9 and the other table templates in WinNonlin is that two datasets are joined to create the final output. The Phoenix Table object only works with one dataset at a time. To produce a table similar to table template 9 it is necessary to use Phoenix’s Join Worksheets object prior to creating the table.
In this example, two datasets are joined by the Sort variables in both datasets. The Default table type in Phoenix is used to recreate table template 9 in WinNonlin. These steps include:
Note:The completed project (Tables.phxproj) is available for reference in …\Examples\Data and Plots.
Recreating WinNonlin’s table template 9 in Phoenix
This example uses two datasets, clayton.CSV and clayton_pk.dat. clayton.CSV contains time and concentration data for two formulations. clayton_pk.dat contains the Final Parameters output from a noncompartmental analysis.
-
From within an project, import the files …\Examples\WinNonlin\Supporting files\clayton.CSV and clayton_pk.dat.
In the File Import Wizard dialog, select the Has units row option for clayton.CSV only. -
Right-click Workflow in the Object Browser and select New > Data > Join Worksheets.
-
Drag the clayton worksheet from the Data folder to the Join Worksheets object’s Worksheet 1 Mappings panel and map the input columns to the contexts as follows:
Map Subject to the Sort context.
Map Form to the Sort context.
Leave Period mapped to None.
Leave Seq mapped to None.
Map Hour to the Source Column context.
Map Conc to the Source Column context. -
Select Worksheet 2 from the Setup list.
-
Drag the clayton_pk worksheet from the Data folder to the Join Worksheets object’s Worksheet 2 Mappings panel and map the input columns to the contexts as follows:
Map Subject to the Sort context.
Map Form to the Sort context.
Map Tmax to the Source Column context.
Map Cmax to the Source Column context.
Map AUClast to the Source Column context.
Leave the rest mapped to None. -
Click
 to execute the object.
 -
Right-click Workflow in the Object Browser and select New > Table > Table.
-
In the Table 1 object’s Mappings panel click
 to open the Select Source dialog.
 -
Expand Join Worksheet, select Result, and click OK.
-
Map the input columns to the contexts as follows:
Map Subject to the Row ID context.
Map Form to the Stratification Row context.
Map Hour to the Stratification Column context.
Map Conc to the Data context.
Map Tmax, Cmax, and AUClast to the Dependency context.
Setting up the summary statistics
-
Select the Statistics tab below the Setup panel.
-
Check the checkboxes in the Display column to select the following summary statistics: N, Mean, SE.
-
Select the Options tab.
-
With Table selected in the Options menu tree, check the Page Break on Row Stratification checkbox.
-
Set the precision for hours to 1.
Expand Precision/Alignment in the Options menu tree and select Hour.
Select 1 in the Value menu. -
Set the precision for subject to 0
Select Precision/Alignment > Subject in the Options menu tree.
Select 0 in the Value menu. -
Enter a title for the table by selecting Titles in the Options menu tree.
-
In the Title field type Table 2 and click Add.
-
In the Title field type Raw Data and Pharmacokinetic Parameters and click Add.
Executing and viewing the results of the joining
-
Click
 to execute the object.
 -
Double-click the Table item under Result Tables.
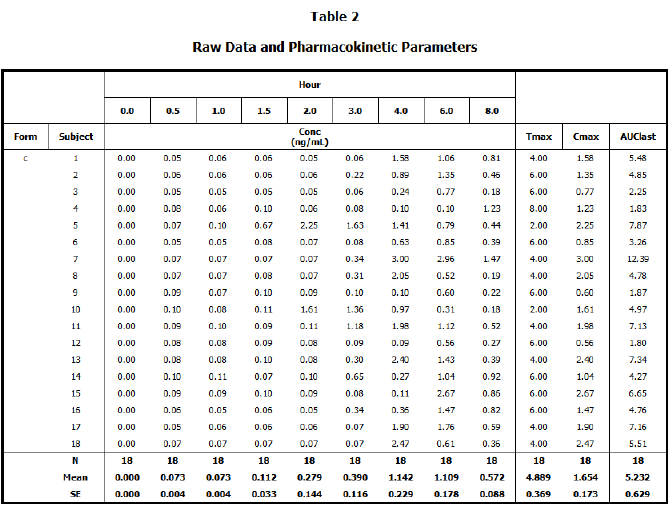
Default table type Formulation c results
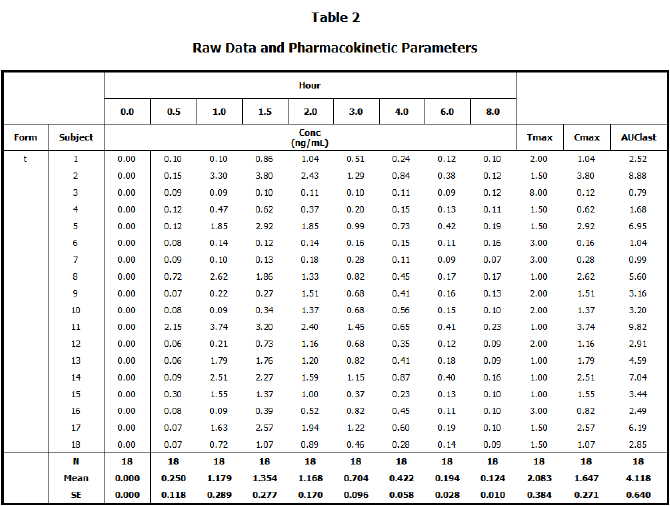
Default table type Formulation t results
This concludes the Joining Raw Data and Model Output in Tables example.
