The Table object generates a report- and analysis-ready HTML table containing worksheet data and optional summary statistics. Eight table types provide a choice of layouts and summary statistics, with flexible formatting options.
Note:The Table object does not use case-sensitive comparisons when sorting and grouping data.
Use one of the following to add a Table object to a Workflow:
Right-click menu for a Workflow object: New > Table > Table.
Main menu: Insert > Table > Table.
Right-click menu for a worksheet: Send To > Table > Table.
Note:To view the object in its own window, select it in the Object Browser and double-click it or press ENTER. All instructions for setting up and execution are the same whether the object is viewed in its own window or in Phoenix view.
Additional information is available for the following topics:
•Table template for merged worksheet data
•Create report-ready table from NCA results example
Use the Main Mappings panel to identify how input variables are used in a Table object. Required input is highlighted orange in the interface.
Click the option buttons in the Main Mappings panels to map the data types in the dataset to the appropriate context associations. Context associations for a Table object change depending on which table type is selected in the Options tab. Required input is highlighted orange in the interface.
None: Data types mapped to this context are not included in any analysis or output.
Row ID: Data types mapped to this context are used to create the rows in the output table.
Data: The observation data used to create the table. Multiple variables in a dataset can be mapped to this context.
Dependency: Dependent values require variables to be mapped to the Row ID and Row Stratification contexts. Dependent values are matched to values mapped to Row ID and Row Stratification and are displayed separately in the output table.
Row Stratification: Data types mapped to this context are used to create row breaks based on individual values in the data type.
Column Stratification: Data types mapped to this context are used to create column breaks based on individual values in the data type.
The Table Preview panel allows users to see a preview of the table output. The Preview Panel is updated any time a new table type is selected in the Table Type menu.
The Options tab list contains several items that allow users to select and format a table.
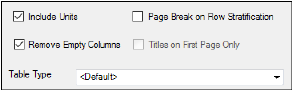
The Table options are used to format the output table.
-
Use the Include Units checkbox to toggle between including/excluding units in the input dataset in the output table. (The default is checked, include units.)
-
Use the Remove Empty Columns checkbox to toggle between removing/including empty columns in the output table. (The default is checked, remove empty columns.)
-
Check the Page Break on Row Stratification checkbox to create a printing page break in the output table for every new value of the variable mapped to the Stratification Row context. Use this option to decrease the uploading time for extremely large tables.
If Page Break on Row Stratification is checked, the Titles on First Page Only checkbox becomes available. -
Check the Titles on First Page Only checkbox to only display the table title on the first page. If unchecked, the title will be repeated on all subsequent pages containing the table.
-
In the Table Type menu, select the table type to use to create the output table.
|
Table Type |
Description |
|
Default |
Computes and displays summary statistics for each column included under Data. Statistics are computed separately for each unique combination of values for the group variable(s), if any. Users can also map variables to the Dependency context. |
|
Table 1 |
Column Summary by Row Stratification |
|
Table 2 |
Column Detail by Row Stratification |
|
Table 3 |
Column Detail and Summary by Row Stratification |
|
Table 4 |
Column Summary by Row and Column Stratification |
|
Table 5 |
Column Detail by Row and Column Stratification |
|
Table 6–7 |
Column Detail and Summary by Row and Column Stratification |
|
Table 8 |
Row Detail by Row and Column Stratification |
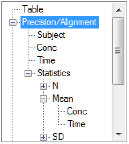
Any study variables mapped to a context other than None and any statistics selected in the Statistics tab are listed under Precision/Alignment.
The following table lists contexts that cause variables to be listed under Precision/Alignment.
|
Table type |
Contexts that display variables in Precision/Alignment list |
Context that displays variables for each summary statistic |
|
Default |
Row ID, Data, Dependency, Row Stratification and Column Stratification |
Data |
|
1 |
Data, Stratification Row |
Data |
|
2 |
Row ID, Data, and Stratification Row |
N/A |
|
3 |
Row ID, Data, and Stratification Row |
Data |
|
4 |
Data, Stratification Row, and Stratification Column |
Data |
|
5 |
Row ID, Data, Stratification Row, and Stratification Column |
N/A |
|
6 and 7 |
Row ID, Data, Stratification Row, and Stratification Column |
Data |
|
8 |
Row ID, Data, Stratification Row, and Stratification Column |
Only one variable can be mapped to the Data context. |
-
Select the Precision/Alignment node.
Setting the numeric precision and output value alignment here will affect all variable columns in the table. -
Select a variable underneath Precision/Alignment.
The options are the same as those available when the Precision/Alignment node is selected. However, setting the numeric precision and output value alignment here will only affect the selected variable’s column.
-
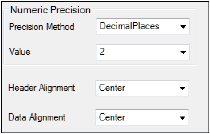
In the Precision Method menu, select Decimal Places or Significant Digits to set the number of digits used to display the values.
-
In the Value menu, select the number of significant digits or decimal places used to display the values.
-
In the Header Alignment menu, select the alignment of the header in the output table.
-
In the Data Alignment menu, select the alignment of the values in the output table.
-
Select a statistic underneath Precision/Alignment in the Options tab list.
Make the same precision and alignment selections for the statistics that were made for the variables.
As with the variables, when the Statistics node is selected, adjustments to the precision and alignment options will affect all of the statistics rows. -
Select a variable underneath a statistic to set the precision and the data alignment. The header alignment option is not available at this level.
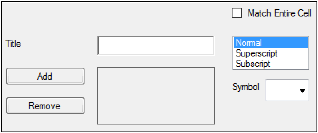
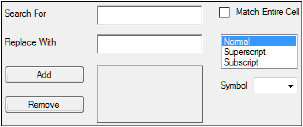
The Title options are used to add titles to the output table.
-
In the Title field, type a title for the table.
-
Select Superscript or Subscript to change the positioning of the text being entered, then select Normal to return to the default positioning.
-
In the Symbol menu, select one of supported symbols to add to the title.
-
Click the Add button to add the title.
-
To remove a title, select the title with the pointer and click the Remove button.
The Column Titles options are used to replace column headers in the input dataset with new headers.
-
In the Search For field, type the column header to be replaced.
-
In the Replace With field, type the column title used to replace the column header in the dataset.
-
Check the Match Entire Cell checkbox to match on the contents of the entire cell during a search/replace (e.g., Subject will match Subject but not Subject 1 or Subject 2). If unchecked, search and replace will match any part of the cell value (e.g., max will find a match in both Tmax and Cmax).
The rest of the options are the same as described in “Title options”.
The Table Body options are used to replace text or numerical values in the input dataset with new values. The options are the same as described in “Column Titles options”.
The Statistics options are used to replace statistic names in the output table. The options are the same as described in “Column Titles options”.
The Footer options are used to add footers to the output table. Simply type the footer in the Footer field. The rest of the options are the same as described in “Title options”.
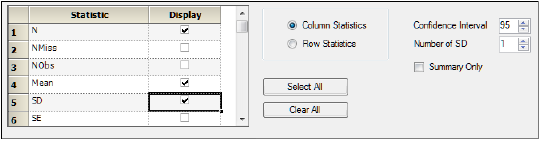
The Statistics tab is used to add summary statistics to a table. Table types 2 and 5 do not allow users to add summary statistics.
For a complete list of available summary statistics and descriptions of each one, see “Statistical results and computational formulas”.
-
Check the Display checkbox beside each summary statistic to include it in the output table.
-
Click the Select All button to select all summary statistics.
-
Click the Clear All button to clear all selected summary statistics.
The Column Statistics and Row Statistics option buttons are automatically selected for table types 1, 3, 4, and 6-8.
The Summary Only checkbox is unavailable for table types 1, 3, 4, and 6-8.
If the Default table type is selected, then users can select the Column Statistics and Row Statistics option buttons and the Summary Only checkbox. -
In the Confidence Interval box, type or select the confidence interval to apply to the summary statistics.
-
In the Number of SD box, type or select the number of standard deviations to apply to the summary statistics.
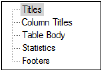
The Style tab list contains several items that allow users to format parts of a table.
-
Select Titles in the Style tab list.
-
Click the Select Font button to open the Font dialog and change the titles font.
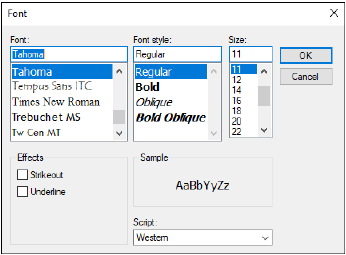
•Select the font type, style, size, effect, and script.
•Click OK to accept the changes or Cancel to leave the font the same.
-
Repeat for Column Titles, Table Body, Statistics, and Footers to make changes to their fonts.
-
To reset all font changes, click the Reset All To Default button.
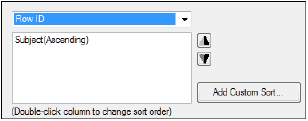
The Column/Sort Order tab allows users to change the arrangement and sort order of data types used to create a table.
-
Select an item from the menu. The items available in the menu change depending on the selected table type and the variables mapped to each context.
Row ID, Row Stratification, or Column Stratification requires at least one variable be mapped to the corresponding context.
Data and Dependency requires two or more variables be mapped the corresponding context.
Statistics requires two or more statistics be selected for display in the Statistics tab. -
To change the sort order of Row ID, Row Stratification, or Column Stratification variables from ascending to descending and back again, double-click the variable.
-
To change the display order of variables or statistics listed, select an item in the list and click the up or down arrow buttons to reorder the list.
-
To sort rows based on a list of row IDs:
•Select the column in the Row ID list.
•Click the Add Custom Sort button to display a second list of all values in that column.
(The word Custom is added to the column’s name in the first list.)
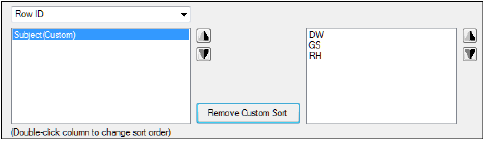
•Select an ID in the second list and use the arrow buttons to change the display order.
•To remove a custom sort order, select the column in the first list and click Remove Custom Sort.
The Custom Tables tab is used to select custom tables. Each custom table has its own set of context mappings and are designed to use with specific datasets.
Custom tables are defined using XSLT files. Each XSLT file must be added to the CustomTables.xml file. By default, all files needed to create custom tables are located in C:\Program Files (x86)\Certara\Phoenix\application\Plugins\Table\Custom.
See an example in “Using custom tables example”.
-
In the Select Custom Table menu, select a custom table.
Phoenix comes with two custom tables:
Bioavailability Statistical Summary: A statistical summary of the comparative bioavailability data.
Bioequivalence Demographics: A demographic profile of subjects completing a bioequivalence study. One table is created per study.
When a custom table is selected, only the Custom Tables tab remains available.
-
In the Select Custom Table menu, select None to return to the normal Table object user interface.
Table: Worksheet containing the output HTML table.
Settings: Text file containing the input worksheet used and the options selected.
Note:Extra-wide tables can become truncated when printed directly from Phoenix. This is due to a print limitation in Internet Explorer. If this occurs, copy the table from the Results tab to the Tables folder and use the Edit in Excel functionality to format as desired.
Table template for merged worksheet data
In WinNonlin 5.2.1, there was a table template 9 that used data from two merged worksheets. For example, merged PK data from an input worksheet and PK parameter estimates from a modeling output worksheet.
This table type presents raw data at different sample times and PK parameters in columns, with a row for each subject or ID variable. It generates summary statistics for each unique combination of group and ID variable values. The two datasets must be merged using these group and ID variable values.
Although no longer available in the Phoenix interface, template 9 can be recreated by selecting the Default table type and using the Merge Worksheets object.
-
Import the source data into a project.
-
Add a Merge Worksheets object to the workflow.
-
Drag the dataset from the Data folder to the Merge Worksheets’ Mappings panel.
-
Merge the worksheets using common sort keys. The variables mapped to the Sort context must match in both worksheets.
The variables do not need to have identical names, but they must be the same type of variable with overlapping sets of values. The variable values are used to merge values from both datasets.
One set of summary statistics are computed for each unique combination of Sort variable values. -
Map other variables to be included in the table to the Included Column context.
-
Check the Carry Along Data For Like Sort Levels checkbox.
-
Execute the Merge Worksheets object.
-
Add a Table object to the workflow.
-
Map the Merge Worksheets object’s Result worksheet to the Table object.
-
In the Table object’s Options tab, select Default in the Table Type menu.
-
Map the variables in the merged dataset to the appropriate contexts.
-
Specify any other table options and execute the Table object.
