Visual Predictive Check (VPC) is only available for population models. With the VPC run mode, the model is first fit with 0 iterations (regardless of the value entered for the Number of Iterations in the user interface) in order to generate the data needed to fill the standard results (such as Residuals, Theta, etc.).
Predictive Check is based on the resulting model fit estimates of Theta, sigma, and Omega. Each simulation replicate generates a dataset just like the original dataset. Both eta (individual variation) and epsilon (observation error) are sampled and used to create a population prediction. Predictive Check provides a series of summary statistics (quantiles) of the simulated data to compare with the observed data.
-
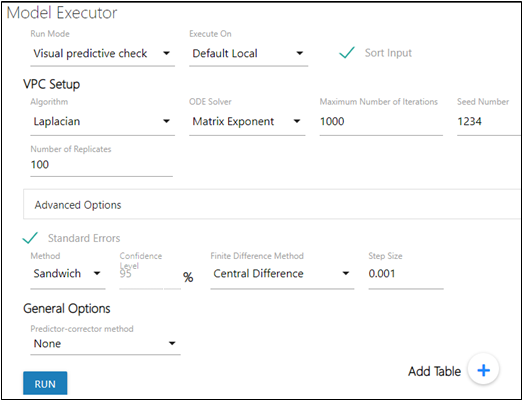
In the Model Executor window, select the Visual Predictive Check from the Run Mode pulldown.
-
Select the local or remote machine or grid on which to execute the job from the Execute On menu.
The contents of this menu can be modified, refer to the “NLME Settings” section in the Pirana user documentation. -
Check the Sort Input checkbox to sort the input by subject and time values.
Refer to the description in the Simple run mode section for more details. -
In the Number of Replicates field, enter the number of datasets to sample for the population prediction.
The maximum number of replicates allowed is 10,000. If the user enters a larger number, only 10,000 will be generated. The value entered applies to all dependent variables. -
Use the Predictive-corrector method pulldown to select the type of correction to use to calculate a prediction-corrected observation.
This option applies to all dependent variables except for discontinuous observed variables (categorical, count, and time-to-event), where this option is ignored. (See ”Prediction and Prediction Variance Corrections” in the Phoenix NLME documentation for calculation details.) -
In the Stratify pulldowns, select up to three defined categorical covariates to stratify the modeling simulation, if it is needed.
This option is available only when a categorical covariate is defined. Up to three levels of stratification are available and the same stratas are applied for all dependent variables unless they are overridden in the observed variable tab. -
Click Add Table to add a simulation table.
For every simulation table added here, there is a results worksheet generated. The options available for a simulation table are described in the Simple run mode “Table” section, except for the following options:
Except for the following, descriptions for the VPC Setup options and Advanced Options can be found in the Simple run mode’s “Estimation” and “Advanced Options” sections.
Refer to the “Standard Errors” description in the Simple run mode section.
–None: do not apply a correction
–Proportional: use the proportional rule.
–Additive: use the additive rule.
If either Proportional or Additive are chosen, two additional options are presented:
–Prediction variance correction: If checked, a prediction-variability corrected observation will be calculated and used in the plots.
–If Output PRED is checked, the population prediction results will be included in the PredCheckAll worksheet as a replicate ‘-1’. If unchecked, the worksheet will only contain information for the replicates.
Note:If the observations do not typically have a lower bound of zero, the Additive option may be more appropriate.
–???For Keep source structure, if checked, keeps the number of rows outputted in the table for each simulation replicate the same as the number of rows in the input datasets.
–For the Variables column, the user can enter any variables (separated by a comma) used in the model.
–Click Structural Parameters below the table to add the parameters defined in the model stparm statement to the Variables field.
