NCA user interface description
Main Mappings panel
Dosing panel
Slopes Selector panel
Slopes panel
Partial Areas panel
Therapeutic Response panel
Units panel
Parameter Names panel
Options tab
User Defined Parameters tab
Rules tab
Plots tab
Use the Main Mappings panel to identify how a dataset is used with an NCA object by mapping data types in a dataset to the appropriate contexts. Context associations change depending on the selected NCA model. Required input is highlighted orange in the interface.
None: Data types mapped to this context are not included in any analysis or output.
Sort: Categorical variable(s) identifying individual data profiles, such as subject ID in an NCA study. A separate analysis is done for each unique combination of sort variable values.
Carry: Data variable(s) to include in the output worksheets. Note that time-dependent data variables (those that change over the course of a profile) are not carried over to time-independent output (e.g., Final Parameters), only to time-dependent output (e.g., Summary).
Plasma study
Time: Nominal or actual time collection points in a plasma study.
Concentration: Drug concentration values in the blood of a plasma study.
(Plasma Models with Sparse Sampling also require a single Subject mapping.)
Urine study
Start Time: Starting times for individual collection intervals during a urine study.
End Time: Ending times for individual collection intervals during a urine study.
Concentration: Dependent variable, drug concentration in urine.
Volume: Volume of urine collected per time interval.
Drug effect study
X: Time values for the drug effect data.
Y: Drug effect or response values.
The Dosing panel allows users to type or map dosing data for the different NCA models.
Models 200–202 (plasma) assume that data were taken after a single dose or after a final dose at steady state. For steady state Phoenix also assumes equal dosing intervals.
Models 210–212 (urine) assume single-dose urine data. If dose time is not entered, Phoenix uses a time of zero.
Model 220 (drug effect) uses the same time scale and units as the input dataset. Users enter the time of the most recent dose for each profile.
The Dosing panel columns change depending on the model type and dose type selected in the Options tab.
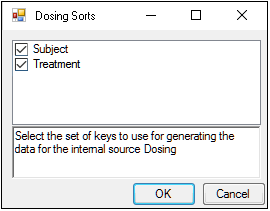
The first time a user selects the Dosing panel, if sort keys are defined in the Main Mappings panel, Phoenix displays the Dosing sorts dialog.

The dialog has all of the currently specified sort variables selected by default. The selected sort variables will be used when creating the internal dosing worksheet. To select a subset of the sort variables, clear the checkbox beside the unwanted variable and click OK.
Context associations change depending on the selected NCA model. Required input is highlighted orange in the interface.
None: Data types mapped to this context are not included in any analysis or output.
Sort: Categorical variable(s) identifying individual data profiles. A separate computation is done for each unique combination of sort variable values.
Time: Time of dose administration.
Dose: Amount of drug per profile.
Tau: The (assumed equal) dosing interval for steady-state data. TAU must be a positive number for steady-state profiles and blank for non-steady-state profiles.
Infusion_Length: Total amount of time for an IV infusion.
Dose_Type: Dosing route, if not defined in the Options tab.
Note:The time units for the dosing data must be the same as the time units for the time/concentration data.
Phoenix attempts to estimate the rate constant, Lambda Z, associated with the terminal elimination phase for concentration data. If Lambda Z is estimable, parameters for concentration data will be extrapolated to infinity. For drug effect models, Phoenix estimates the two slopes at the beginning and end of the data. NCA does not extrapolate beyond the observed data for drug effect models.
The observed times for each profile are displayed in a graph on separate tabs in the Slopes Selector panel. Below are usage instructions. For descriptions of how the NCA object determines Lambda Z or slope estimation settings, see “Lambda Z or Slope Estimation settings”.
Note:Any changes to the settings available in the Slopes Selector panel also affect the Slopes panel and vice versa.
-
Use the View menu to select a linear (Lin) or logarithmic (Log) axis scale.
-
Use the Lambda Z Calculation Method menu to select a method.
If Best Fit is selected, Phoenix calculates the points for Lambda Z estimation for each profile.
If Time Range is selected, users must enter the start and end times for Lambda Z estimation. -
To turn off Lambda Z or slope estimation for all profiles, select the Disable Curve Stripping checkbox in the Options tab. For more information see step 4 in “Model settings”.
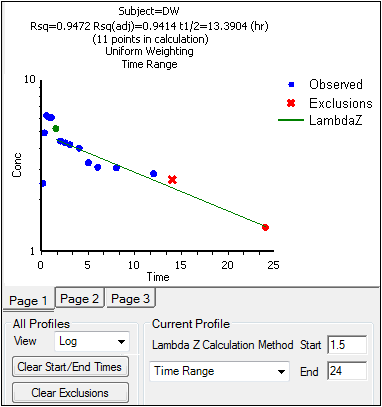
Users can manually select start times, end times, and excluded time points by selecting them on the graph for each profile (this action automatically sets the Lambda Z Calculation Method to Time Range.
Click a data point on a graph to select the start time.
SHIFT+click a data point on a graph to select the end time.
CTRL+click a data point on a graph to exclude the time point.
Change the start time, end time, and exclusions by selecting new points on the graph using the same key combinations listed above.
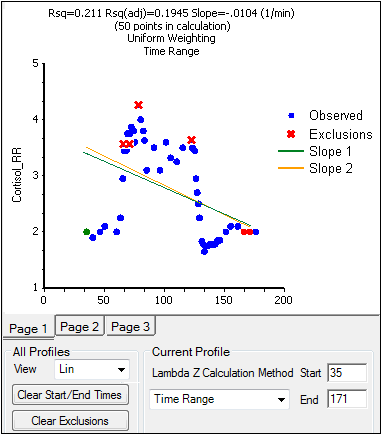
When the start time, end time, and exclusions are manually selected, the graph title is updated to show the new R2 calculation, the graph is updated to show the new slope, and the legend is updated to show the new slope and exclusions, as shown below.

Note:Excluded data points apply only to Lambda Z or slope calculations. The excluded data points are still included in the computation of AUCs, moments, etc.
Note:Avoid having excluded or zero-valued points at the beginning or end of the Lambda Z range as this can result in inconsistent reporting of the Lambda Z range.For example, if values range from 0.8 to 2 and points before 1.4 are excluded, some of the output reports the range as (0.8, 2), whereas other output lists the range as (1.4, 2).
-
Use the Clear Start/End Times button to have previously selected start time and end time points removed from the graphs in the Slopes Selector panel and from the worksheet in the Slopes panel.
-
Use the Clear Exclusions button to have previously excluded time points included in the graphs in the Slopes Selector panel and in the worksheet in the Slopes panel.
The Drug Effect (220) model calculates two slopes per profile
-
Under Slope Calculation in the Slopes Selector panel, select Slope 1 or Slope 2.
-
Select Linear or Log to set the slope calculation method for slope 1 or slope 2.
-
Use the instructions listed above to select the start times, end times, and exclusions.

The start time, end time, and exclusions used in the calculation of Lambda Z for each profile are defined in the Slopes panel. Users can type the time points for each profile.

Below are usage instructions. For descriptions of how the NCA object determines Lambda Z or slope estimation settings, see “Lambda Z or Slope Estimation settings”.
Note:Any changes to the settings available in the Slopes panel also affect the Slopes Selector panel and vice versa.
-
Type the start and end time values in the Start Time and End Time columns for each profile.
-
Type excluded time points in the Exclusions column for each profile.
-
Exclude multiple time points for a profile by typing the time points in the same cell and separating the time points with a semicolon.
-
Use the Fit Method menu to specify the method.
If Best Fit is selected, Phoenix calculates the points for Lambda Z estimation.
If Time Range is selected, users must enter the start and end times for Lambda Z estimation. -
To turn off Lambda Z or slope estimation for all profiles, select the Disable Curve Stripping checkbox in the Options tab. For more information see step 4 in “Model settings”.
The Slopes panel for the Drug Effect (220) model also includes options for the slope calculation method.
-
In the Lin/Log column, select Linear or Log to set the slope calculation method.
-
Use the same instructions listed above to select the start times, end times, and exclusions.
The Partial Areas panel includes settings for the computation of partial areas under the curve. Partial area computations are optional. It is not necessary to enter or add any start times or end times in this panel. For descriptions of how the NCA object computes partial areas, see “Partial area calculation”.
None: Data types mapped to this context are not included in any analysis or output.
Sort: Categorical variable(s) identifying individual data profiles, such as subject ID in an NCA study. A separate analysis is done for each unique combination of sort variable values.
Area #: Number to identify the defined partial area.
Label: Title to use as a label for the defined partial area.
Start Time: The time at which to begin the partial area calculation.
End Time: The time at which to end the partial area calculation.
Some additional notes on partial areas:
•Partial area computations are optional. To skip the computations leave the Start Time and End Time columns empty.
•Up to 127 partial areas can be computed per subject.
•The start times and end times can be after the last observed time if Lambda Z is estimable.
The Therapeutic Response panel allows users to determine the time spent within a therapeutic range, and the AUC within the therapeutic range, by using the lower and upper therapeutic response values. For descriptions of how the NCA object handles therapeutic response data, see “Therapeutic response”.
Setting the therapeutic response values is optional for plasma (200–202) and urine (210–212) models. Setting the baseline is recommended for drug effect models (220). The Min Response and Max Response columns show the minimum and maximum concentrations, rates, or responses contained in the datasets.
Caution:When entering or mapping the lower and upper therapeutic ranges of profiles in an NCA urine model, users must enter or map the rate of excretion.
None: Data types mapped to this context are not included in any analysis or output.
Sort: Categorical variable(s) identifying individual data profiles, such as subject ID and treatment in a crossover study. A separate analysis is performed for each unique combination of sort variable values.
Lower (Plasma and Urine study) / Baseline (Drug Effect study): The lower concentration, rate, or response for defining the lower boundary of the target range. This is the lower effect value for each profile. It is required when an external worksheet is mapped. If not specified for the drug effect model, a baseline of zero is used.
Upper (Plasma and Urine study) / Threshold (Drug Effect): The upper concentration, rate, or response for defining the upper boundary of the target range.
Threshold is the effect value used to calculate additional times and areas. See the “Drug effect data model 220” section.
An NCA object’s display units can be changed to fit a user’s preferences. Each parameter used in a model and the parameter’s default units are listed in the Units panel. Required input is highlighted orange in the interface.
For plasma models (200–202), the time and concentration data must contain units before users can set preferred units.
For plasma models (200–202), the dosing unit must be set before users can set preferred units.
For urine models (210–212), the start time, end time, concentration, and volume data must contain units before users can set preferred units.
For the drug effect model (220), the time and effect data must contain units before users can set preferred units.
•None: Data types mapped to this context are not included in any analysis or output.
•Name: Model parameters associated with the units.
•Default: The model object’s default units.
•Preferred: The user’s preferred units for the parameter.
Note:if you see an “Insufficient units” message, check that units are defined for time and concentration in your input.
Phoenix provides the option to specify the names for NCA model parameters.
None: (In mapped worksheet only) Rows mapped to this context are not included in any analysis or output.
Parameter Name: In the internal worksheet, Phoenix’s default parameter names are listed in this column. For a mapped worksheet, click in the cell to indicate that the name in that row is a parameter name.
Preferred (Name): In the internal worksheet, edit the name that will appear in the output. For a mapped worksheet, click in the cell to indicate that the name in that row is a preferred name.
Include in Workbook: Indicate whether or not a parameter is included as final parameter in the workbook output.
Note:Parameter names cannot contain empty spaces. The case of each preferred parameter name is preserved.
For more on NCA output parameters see “NCA parameter formulas”.
