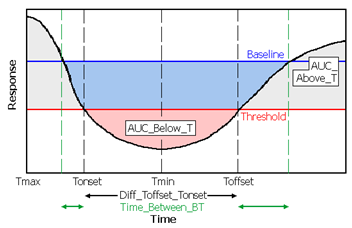
Illustration of a time-effect curve with AUCs highlighted
Output parameter names use the following conventions:
B is the baseline effect value (discussed above).
T is the user-supplied threshold effect value.
“Above” means towards increasing Y values, even for inhibitory effects.
Estimated parameters for model 220
N_Samples: This parameter reports the number of non-missing observations used in the analysis of the profile (time is at or after dosing time, the observation is numeric, and the volume is positive for urine models). It does not count points inserted by engine, e.g., inserted at dosing time.
Slope1 (or 2): Slope of the first (or second) segment of the curve. See “Lambda Z or Slope Estimation settings”.
Rsq_Slope1 (or 2): Goodness of fit statistic for slope 1 or 2.
Rsq_adj_Slope1 (or 2): Goodness of fit statistic for slope 1 or 2, adjusted for the number of points used in the estimation.
Corr_XY_Slope1 (or 2): Correlation between time (X) and effect (or log effect, for log regression) (Y) for the points used in the slope estimation.
No_points_Slope1 (or 2): The number of data points included in calculation of slope 1 or 2.
Slope1_lower or Slope2_lower: Lower limit on Time for values to be included in the slope calculation.
Slope1_upper or Slope2_upper: Upper limit on Time for values to be included in the slope calculation.
Tmin: Time of minimum observed response value (Rmin).
Rmin: Minimum observed response value.
Tmax: Time of maximum observed response value (Rmax).
Rmax: Maximum observed response value.
Baseline: Baseline response (Y) value supplied by the user, (assumed to be zero if none is supplied) or, for Certara Integral studies with no user-supplied baseline value, effect value at dose time.
AUC_Above_B: Area under the response curve that is above the baseline (dark gray areas in the above diagram).
AUC_Below_B: Area that is below the baseline and above the response curve (combined blue and pink areas in the above diagram).
AUC_Net_B: = AUC_Above_B – AUC_Below_B. This is likely to be a negative value for inhibitory effects.
Time_Above_B: Total time that Response is greater than or equal to Baseline.
Time_Below_B: Total time that Response is less than Baseline.
Time_%Below_B: = 100*Time_Below_B/(Tfinal – Tdose), where Tfinal is the final observation time and Tdose is dosing time.
When a threshold value is provided, model 220 also computes the following.
Threshold: Threshold value used.
AUC_Above_T: Area under the response curve that is above the threshold value (combined light and dark gray areas in the above diagram).
AUC_Below_T: Area that is below the threshold and above the response curve (pink area in the above diagram).
AUC_Net_T: = AUC_Above_T – AUC_Below_T
Time_Above_T: Total time that Response >= Threshold.
Time_Below_T: Total time that Response < Threshold.
Time_%Below_T: = 100*Time_Below_T/(Tlast – Tdose)
where Tlast is the final observation time and Tdose is dosing time.
Tonset: Time that the response first crosses the threshold coming from the direction of the baseline value, as shown in the above diagram. Tonset=Tdose if the first response value is across the threshold, relative to baseline. The time will be interpolated using the calculation method selected in the model options. (See “Options tab”.)a
Toffset: Time greater than Tonset at which the curve first crosses back to the baseline side of threshold, as shown in the diagram above.a
Diff_Toffset_Tonset: = Toffset – Tonset
Time_Between_BT: Total time spent between baseline and threshold (sum of length of green arrows in diagram).
AUClower_upper: (Optional) user-requested area(s) under the curve from time “lower” to time “upper”.
aUse caution in interpreting Tonset and Toffset for noisy data if Baseline and Threshold are close together.
