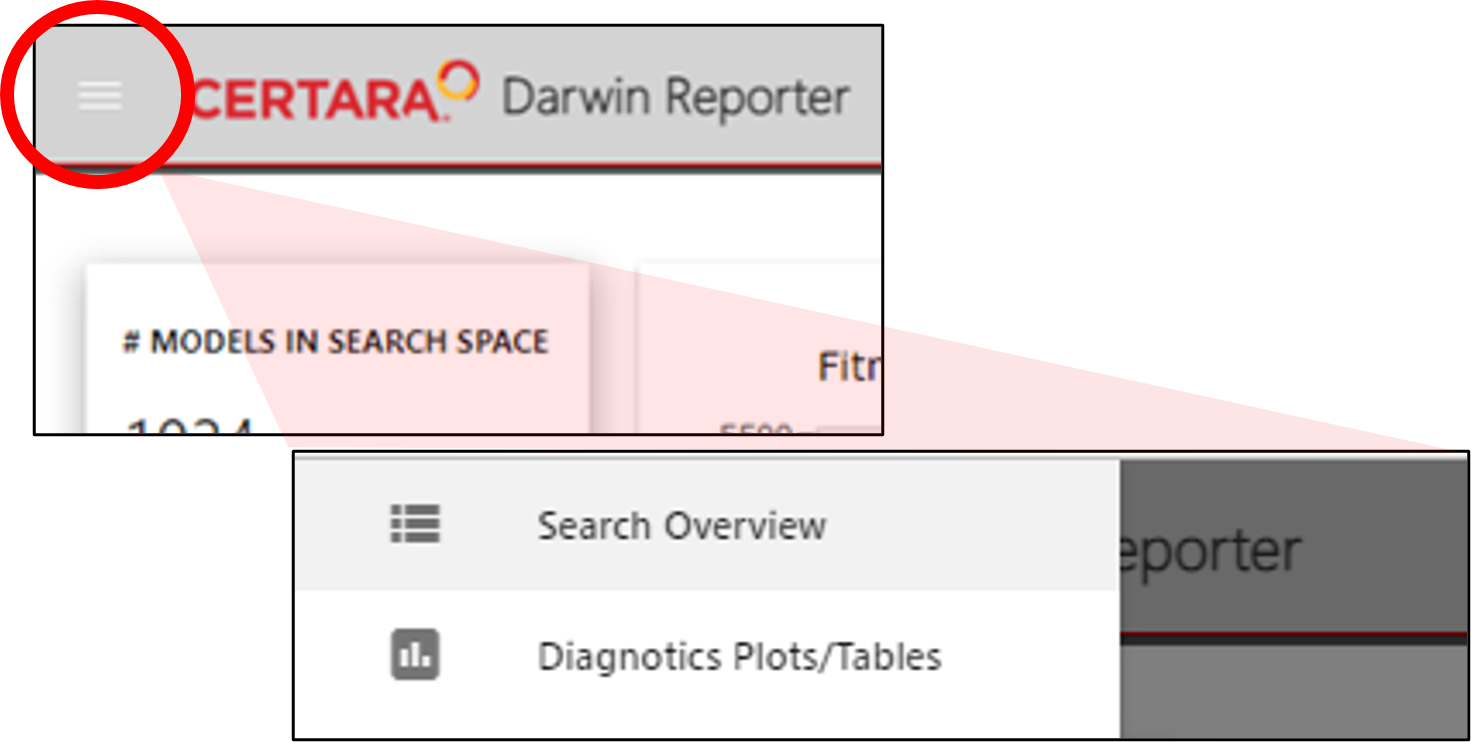
Select the upper-left icon in the title bar to switch between the overview page and the diagnostics tools.
Or click ![]() in the plots column on the Overview page.
in the plots column on the Overview page.
From the Diagnostics Plots/Tables page, return to the Overview page by clicking the Back to Search Overview link in the upper left corner or use the icon in the title bar.
Note: The process of tagging diagnostics and the Tagged tab in Darwin Reporter are identical to the Model Results Shiny app, described in “Tagging a diagnostic”.