In the Preview tab, choose the desired model from the Key Model pull-down.
Select the plot/table to preview from the tree use the Search field.
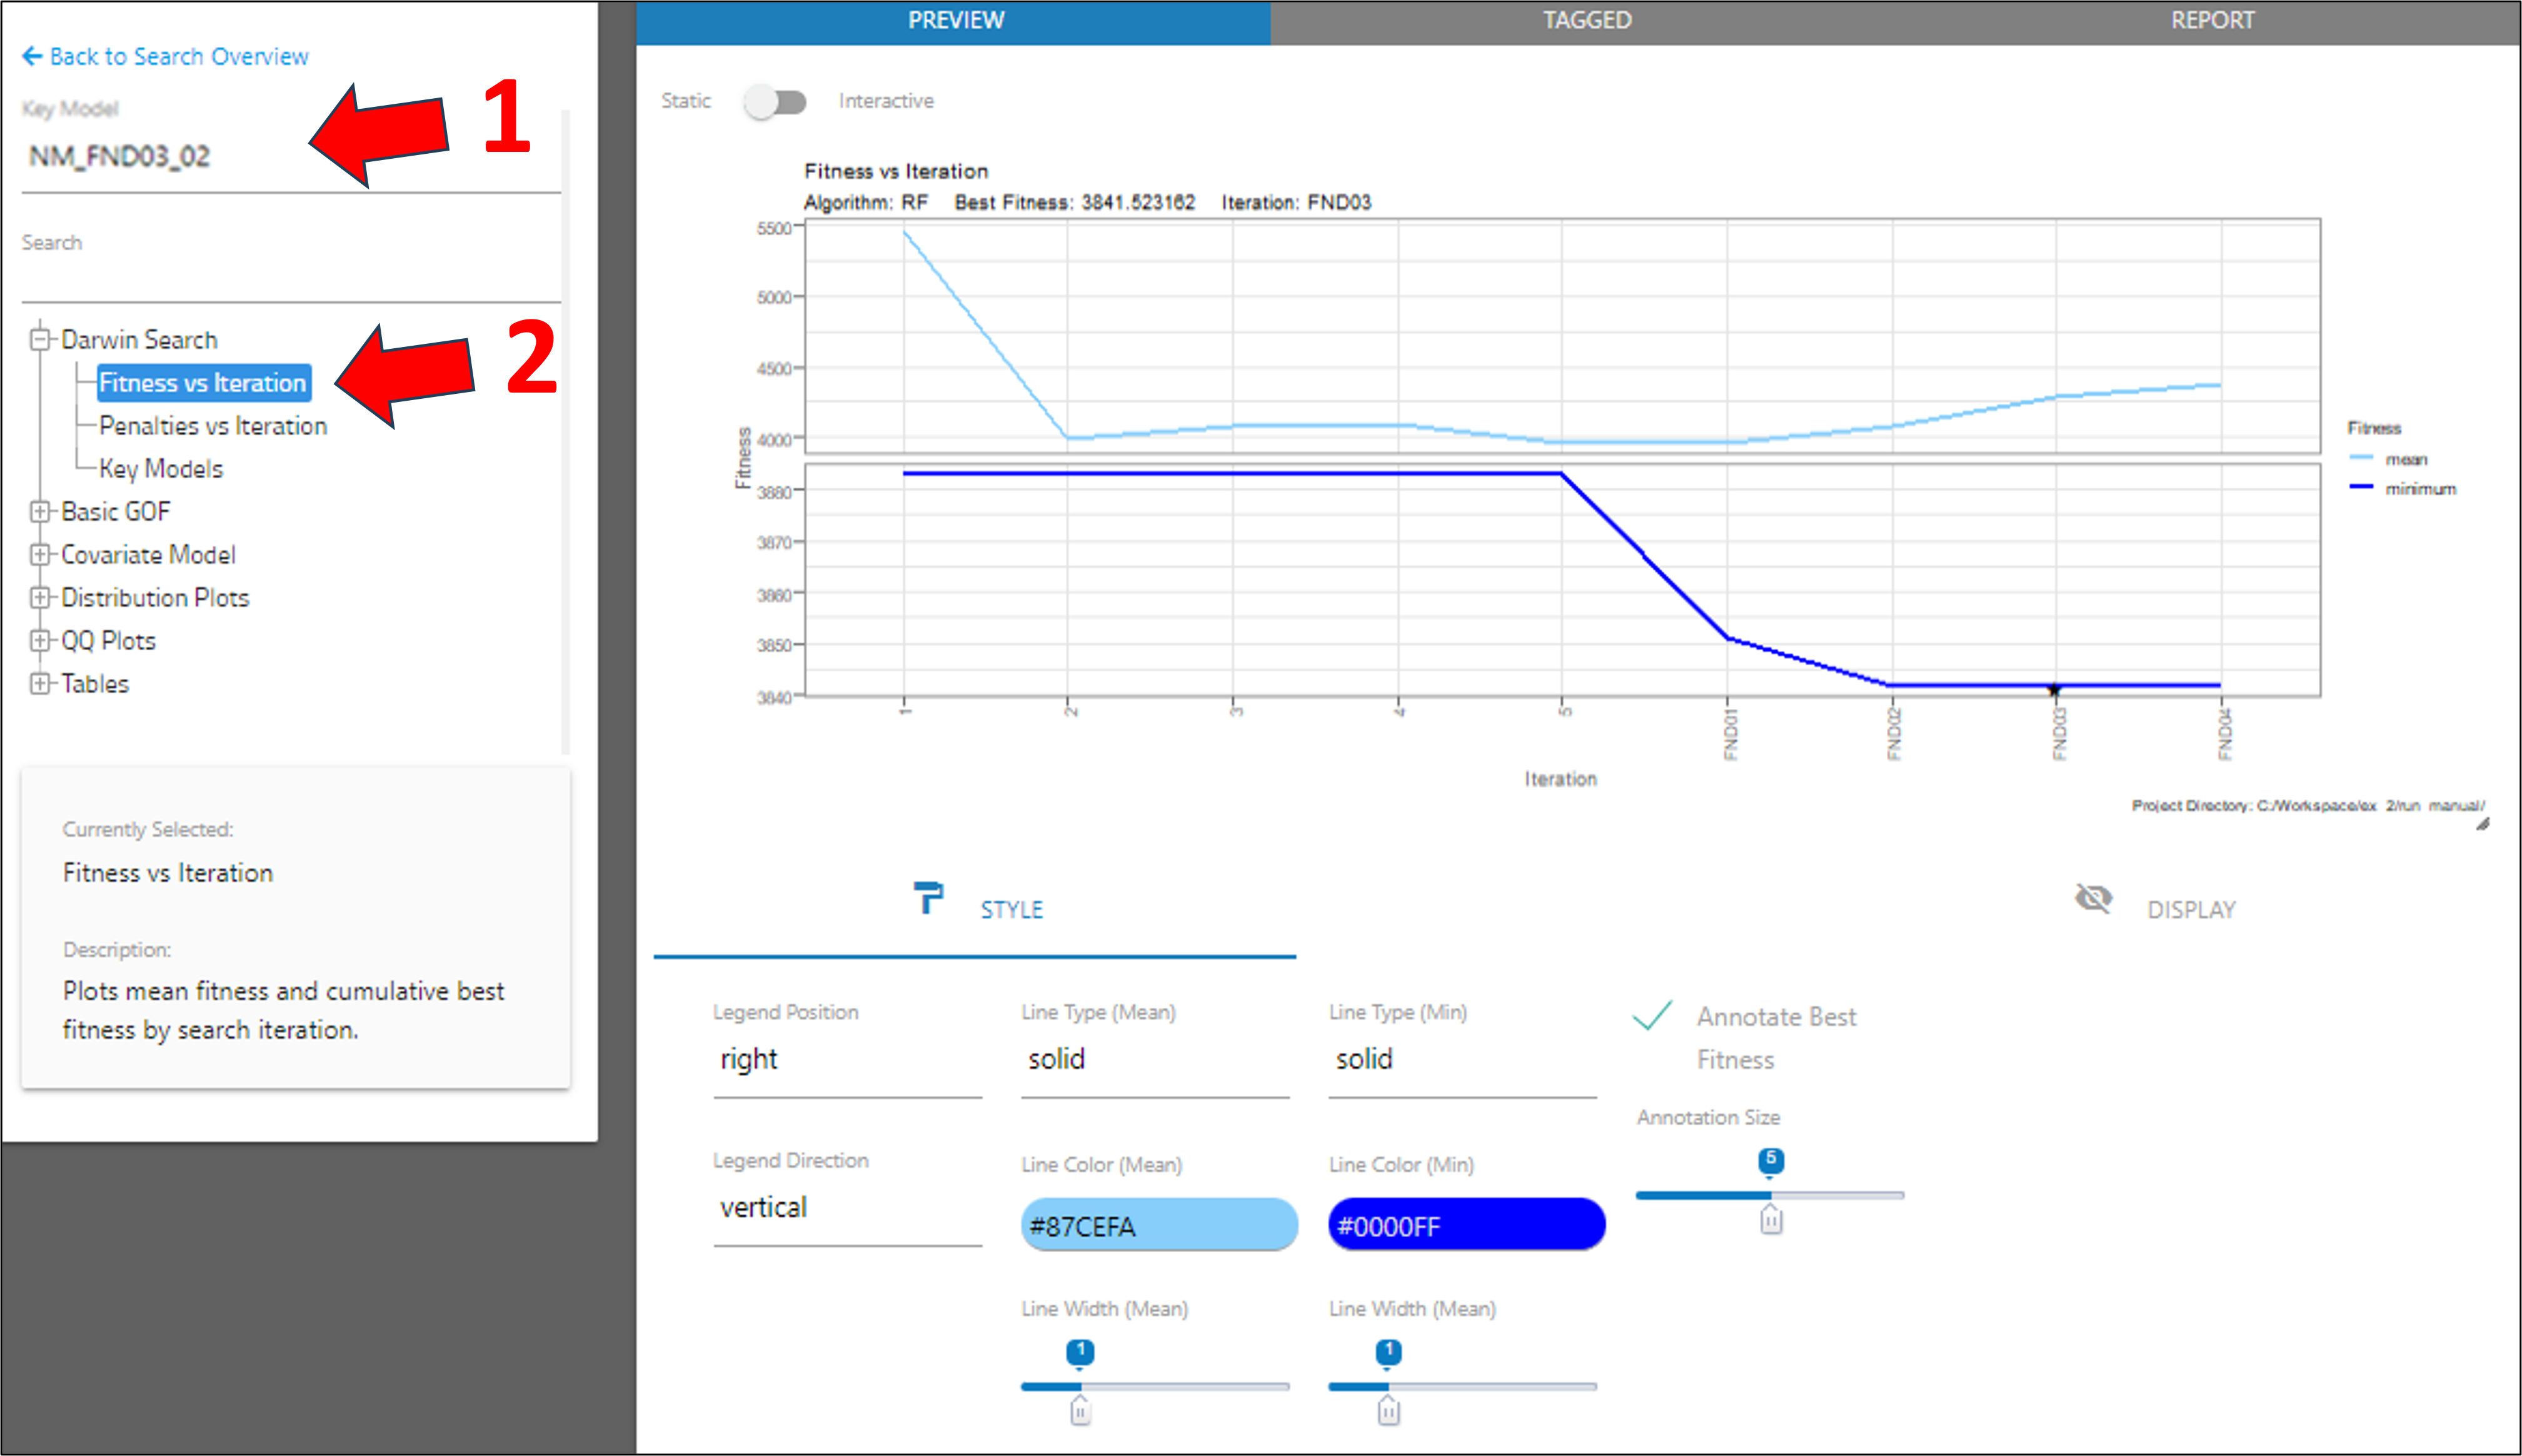
There are two plots and one table that are specific to Darwin searches: Fitness vs Iteration plot (shown in the previous image), Penalties vs Iteration plot, and Key Models table. Other than what is discussed in this section, the plots, tables, and customization options are the same as in the Model Results Shiny app (refer to Model Results Shiny app’s “Preview plots” and “Preview tables” subsections).
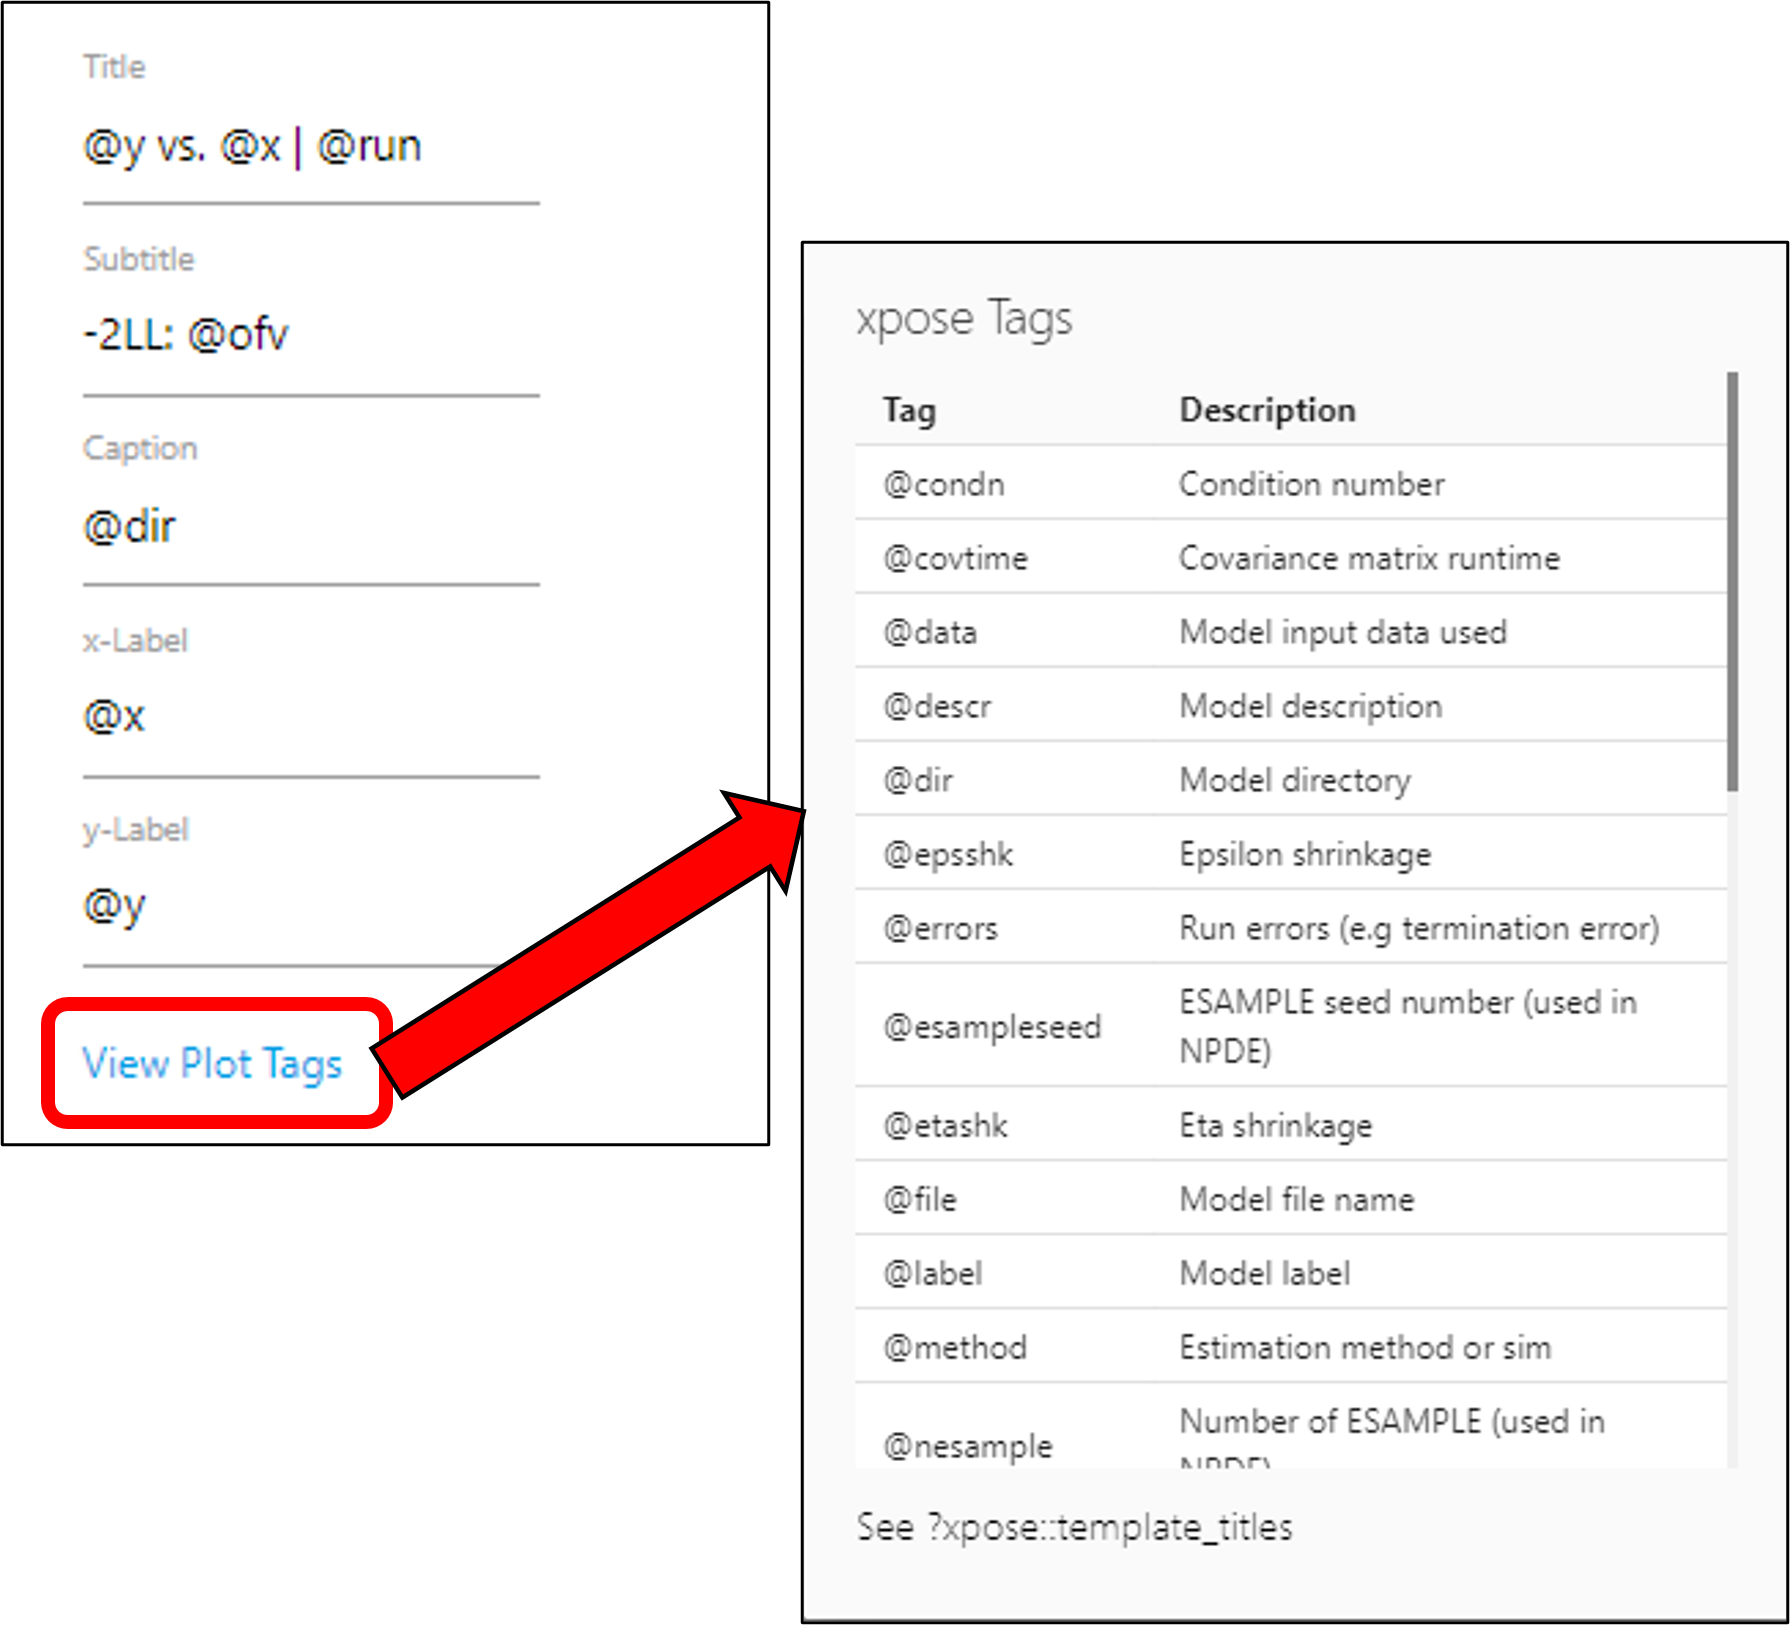
On the Display tab for the plots, several fields accept xpose tags as variables to define titles, captions, and axis labels. Select the View Plot Tags to see a list of xpose tags that can be entered.