Note: The graphical model interface is a free-form model-building interface. It is much more sophisticated than the built-in model and is recommended for more advanced users.
To use the graphical editor to create the structural model:
In the Setup tab list, select the Model panel.
A graphical display of the model as it is currently defined is displayed. This is only an image of the model and cannot be edited, which is why the tools to the left of the display are not active.
To enter Graphical mode and activate the graphical editor tools, press Edit as Graphical in the Properties tab.
Press Yes in the dialog to confirm using the graphical editor.
If Closed form? is currently checked, a second dialog is presented notifying that closed-form will not be used because graphical models are built with differential equations. Press Yes to continue.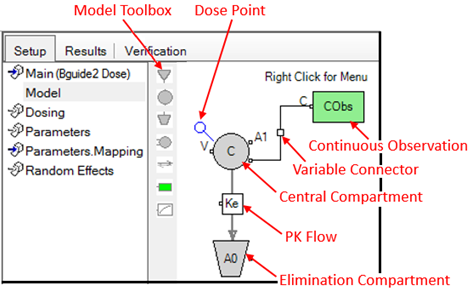
The previous image is an example of a one-component, 1st order absorption PK model.
When the graphical editor is in use, the Edit as Graphical button changes to Use Builtin. Press this button to return to the built-in model interface.
The Main Mappings, Dosing, Parameters, and Parameters.Mappings panels and all tabs (except the Structure tab) work the same in the Graphical mode as they do in the Built-in mode.
Adjust the graphical model scale by dragging the Scale slider right or left, which makes the model picture (and tools) larger or smaller, respectively.
To view and edit settings for a compartment, select the compartment in the model display.
The compartment-specific settings are displayed in the Structure tab. (Descriptions of these settings are available via the links in the table below.
To change the model diagram, use the Model toolbox or the right-click menu.
The right-click Insert menu allows insertion of compartments, flows, observations, PD blocks, structural parameters, and other model elements. The menu also provides access to cut, copy, paste, and manipulate model elements. (The difference between Replace and Insert is that the former replaces the selected objects in the diagram with the contents of the clipboard while trying to retain wire and flow connections. The latter just copies the contents of the clipboard into the diagram.)
Table 1: Model Elements
Element Type
Tool Icon
Link to Options Descriptions
Absorption compartment  (See “Absorption compartment options”)
Central compartment  (See “Central compartment options”)
Peripheral compartment  (See “Peripheral compartment options”)
Elimination compartment  (See “Elimination compartment options”)
Flow (See “PK Flow”)
Continuous observations (See “Continuous observation block”)
Categorical observations (See “Categorical observation block”)
Event observations (See “Event observation block”)
Count observations (See “Count observation block”)
LL observations (See “Log-likelihood observation block”)
Emax  (See “Emax block”)
Linear (See “Linear block”)
Indirect (See “Indirect block”)
Effect Cpt (See “Effect compartment block”)
Parameter (See “Parameter block”)
Procedure (See “Procedure block”)
Expression (See “Expression block”)
Code (See “Code block”)
Annotation (See “Annotation block”)
PBPK (See “Vascular flow”)
Note: When switching from a PK/Emax, or PK/Indirect built-in to a Graphical model, verify the tab settings. In particular, the Freeze PK? checkbox, when checked in the built-in model, can become unchecked when switching to Graphical.