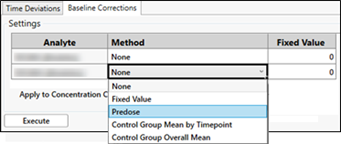
For each analysis, set the baseline correction method using the Method column.
None: Do not apply a correction.
Fixed Value: Enter a fixed number for the correction value. The corrected value is calculated as Concentration — Baseline Fixed.
Predose: Take the predose for Day 1 (where NominalTime = 0) and use it as the correction value for that profile. The corrected value is calculated as: Concentration — Predose Concentration. This option is applicable to Serial studies only.
Control Group Mean by Timepoint: Use the mean value for the control group at each timepoint as the correction. This method averages the concentration of all subjects in the control group per timepoint and then calculates the corrected value as: Concentration – Average Baseline Concentration per Timepoint.
Control Group Overall Mean: Use the overall mean value for the control group as the correction. This method averages the concentration of all subjects in the control group, then calculates the corrected value as: Concentration – Average Baseline Concentration.
The last two options require that a control group already be defined. Refer to the “Setup dosing” section. If one of these options are selected and there is no control group defined, no baseline correction results will be returned.
Choose the concentration columns to receive the correction using the Apply to Concentration Columns checkboxes.
Press the Execute button.
Upon completion of the execution, two columns are appended to the Results table plus another column for each chosen concentration column.
BaselineCorrection: The correction value applied.
BaselineCorrectionMethod: The correction method used to compute the corrected value.
BC_PKConcentration, BC_PlotsConcentration, BC_DisplayConcentration: The actual baseline-corrected concentration.