View and compare parameter estimates
A list of parameter estimates is available in the Estimates tab in the right section of the Pirana window.
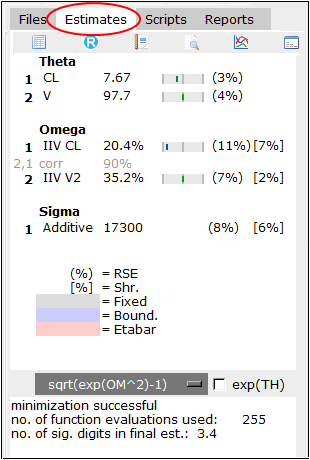
Through the use of brackets and color additional information is presented in the Estimates tab.
(RSE for parameters is shown in round brackets)
[Shrinkage for the random effects is shown in square brackets]
Parameters where the final gradients were zero have red text
Parameters were fixed have a gray background
Parameters where boundaries were encountered have a blue background
Parameters where the mean of eta-distribution was significantly different from zero include the etabar with a red background
Using the Estimates tab toolbar, you can easily access the following tools and functionality:
–![]() : Display the Parameter Estimates dialog, which gives a more detailed list of estimates.
: Display the Parameter Estimates dialog, which gives a more detailed list of estimates.
–![]() : Export the estimates using R.
: Export the estimates using R.
–![]() : Generate report.
: Generate report.
–![]() : View the NM output file.
: View the NM output file.
–![]() : Open dataset/output files in DataInspector
: Open dataset/output files in DataInspector
–![]() : View matrix. Select type of matrix from the pop-up menu (see “Matrices” for more information).
: View matrix. Select type of matrix from the pop-up menu (see “Matrices” for more information).
The more detailed Parameter Estimates dialog can be accessed using the any of the following methods:
–Click ![]() in the Pirana toolbar.
in the Pirana toolbar.
–Click ![]() in the Estimates tab toolbar.
in the Estimates tab toolbar.
–Select Results > Show/compare parameter estimates.
–Select View > Show parameter estimates.
–Right-click a selected model in the model overview list and choose Model > Parameter estimates from the menu.
–Right-click a selected model in the model overview list and choose Batch operations > Show parameter estimates from the menu.
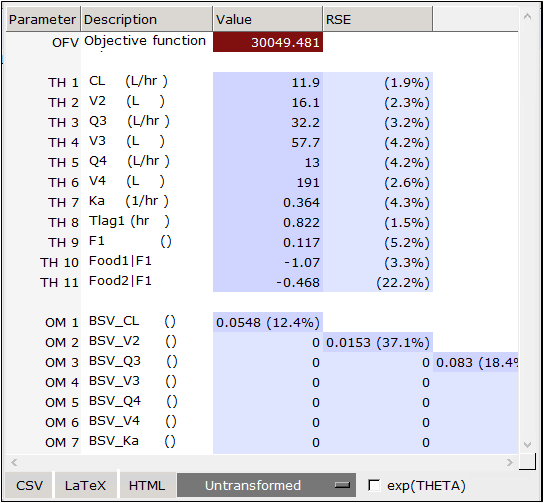
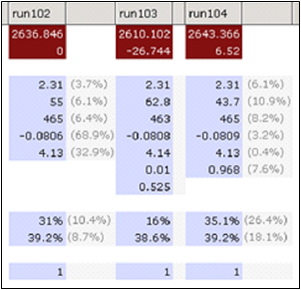
If multiple models/runs are selected when the Parameter Estimates dialog is opened, the parameter estimates for all selected runs are presented, side-by-side, facilitating comparison.
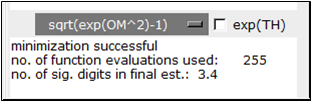
The pull-down menu offers different choices for transforming the variances. Options include: Untransformed, (sqrt(OM^2), and (sqrt(exp(OM^2)-1).
Check the exp(THETA) box to back transform thetas that have been log-transformed in model code.
Note:Pirana will automatically back-transform when the parameter description includes the text “[log]”, e.g.:
#THETA
(0.,1.6,4.) ;KA [log]
From the dialog, convert results into CSV format, LaTeX, or HTML for reports or further analysis using the buttons along the bottom.

