Plotting the VPC data using Xpose
This section provides steps to generate a VPC plot, however Xpose offers many graphing options. See “Diagnostic graphs with Xpose” for a more information about the Run Xpose commands dialog or refer to “Generate Xpose graphs through R” for an alternative mechanism.
-
Select the model for which the VPC was executed.
-
Right-click the selected model and choose Xpose > Xpose GUI in the menu.
Or
Select Results > Xpose > Xpose GUI.
Or
Click in the toolbar.
 -
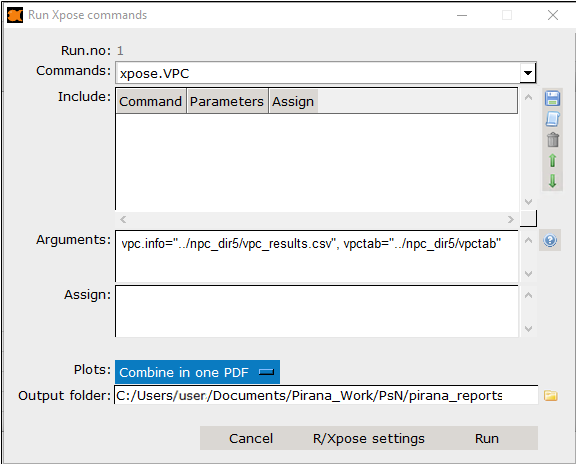
In the Run Xpose commands dialog, select xpose.VPC from the Commands pull-down.
-
Enter arguments for Xpose.VPC in the Arguments field.
The Xpose.VPC help files may be accessed using .
. -
Select the plots to generate from the Plots pull-down.
Combine in one PDF
Create in R environment
Save as PNGs
Save as separate PDFs -
Specify the location for the output in the Output folder field (click
 to navigate to and select the folder).
 -
Press Run to execute.
Tweaking the VPC plot
These VPCs may be further optimized by adjusting the many Xpose arguments. Please check out the Xpose VPC help files (which may be accessed from the Run Xpose command dialog, or go to the Xpose website for more information).
