Before Xpose diagnostic graphics can be generated, the model first needs to be executed while generating output tables in a specific format and naming.
Briefly, for a model named run10.mod, output tables such as sdtab10 (observations/predictions), patab10 (parameters), cotab10 (continuous covariates), and catab10 (categorical covariates) should be generated, with the NOPRINT and ONEHEADER options.
For more information on how to generate Xpose-ready $TABLE output files, refer to the Xpose manual.
-
Click
 in the toolbar.
Or
From the right-click menu of a selected model that has been executed, choose Xpose > Xpose GUI.
Or
Select Results > Xpose > Xpose GUI from the main menu. -
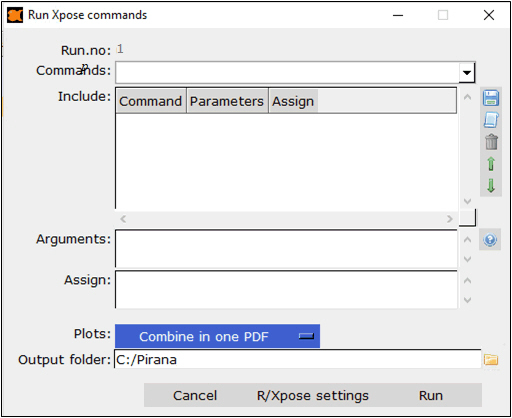
In the dialog, use the Commands menu to add Xpose plots to the Included list.
-
Enter additional Arguments for each Xpose command in the field.
A reference to possible arguments is provided under the sign.
sign.
The general plotting arguments for PDF and PNG (e.g., width=10, height=8) can be specified in the Settings dialog (see R/Xpose setup). -
Select an output format from the Plots pull-down.
-
Enter the location for the generated plots in the Output folder field or click the
 to browse to the location.
 -
Click R/Xpose Settings to display R/Xpose setup (sub-tab of Software Integration) in the Settings dialog.
-
Click Run to generate the plots.
–Save and load the commands by clicking ![]() and
and ![]() , respectively. This can be useful e.g. for standardized report generation.
, respectively. This can be useful e.g. for standardized report generation.
–Select a command in the list and click ![]() to remove it.
to remove it.
–Use the up and down arrows to reorder the commands.
–Combine in one PDF
–Generate PNG
–Generate the R-code only
–Generate Sweave code for LaTeX documents
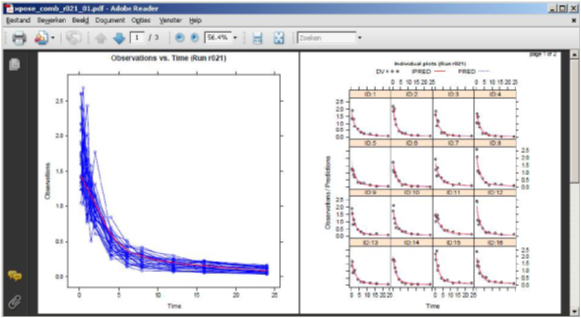
If output was directed to a PDF file, the PDF will be opened automatically once it is generated.
Generate Xpose graphs through R
Alternatively, it is possible to automatically open the text-based Xpose menu in R from within Pirana.
-
Select the executed model in the model overview list.
-
Right-click the selected model and choose Xpose > Start Xpose menu in R.
Or
Select Results > Xpose > Start Xpose menu from the main menu.
The Xpose menu is started in R and the associated table files are loaded into Xpose, where graphs may be generated. Refer to the Xpose4 help for additional information.
