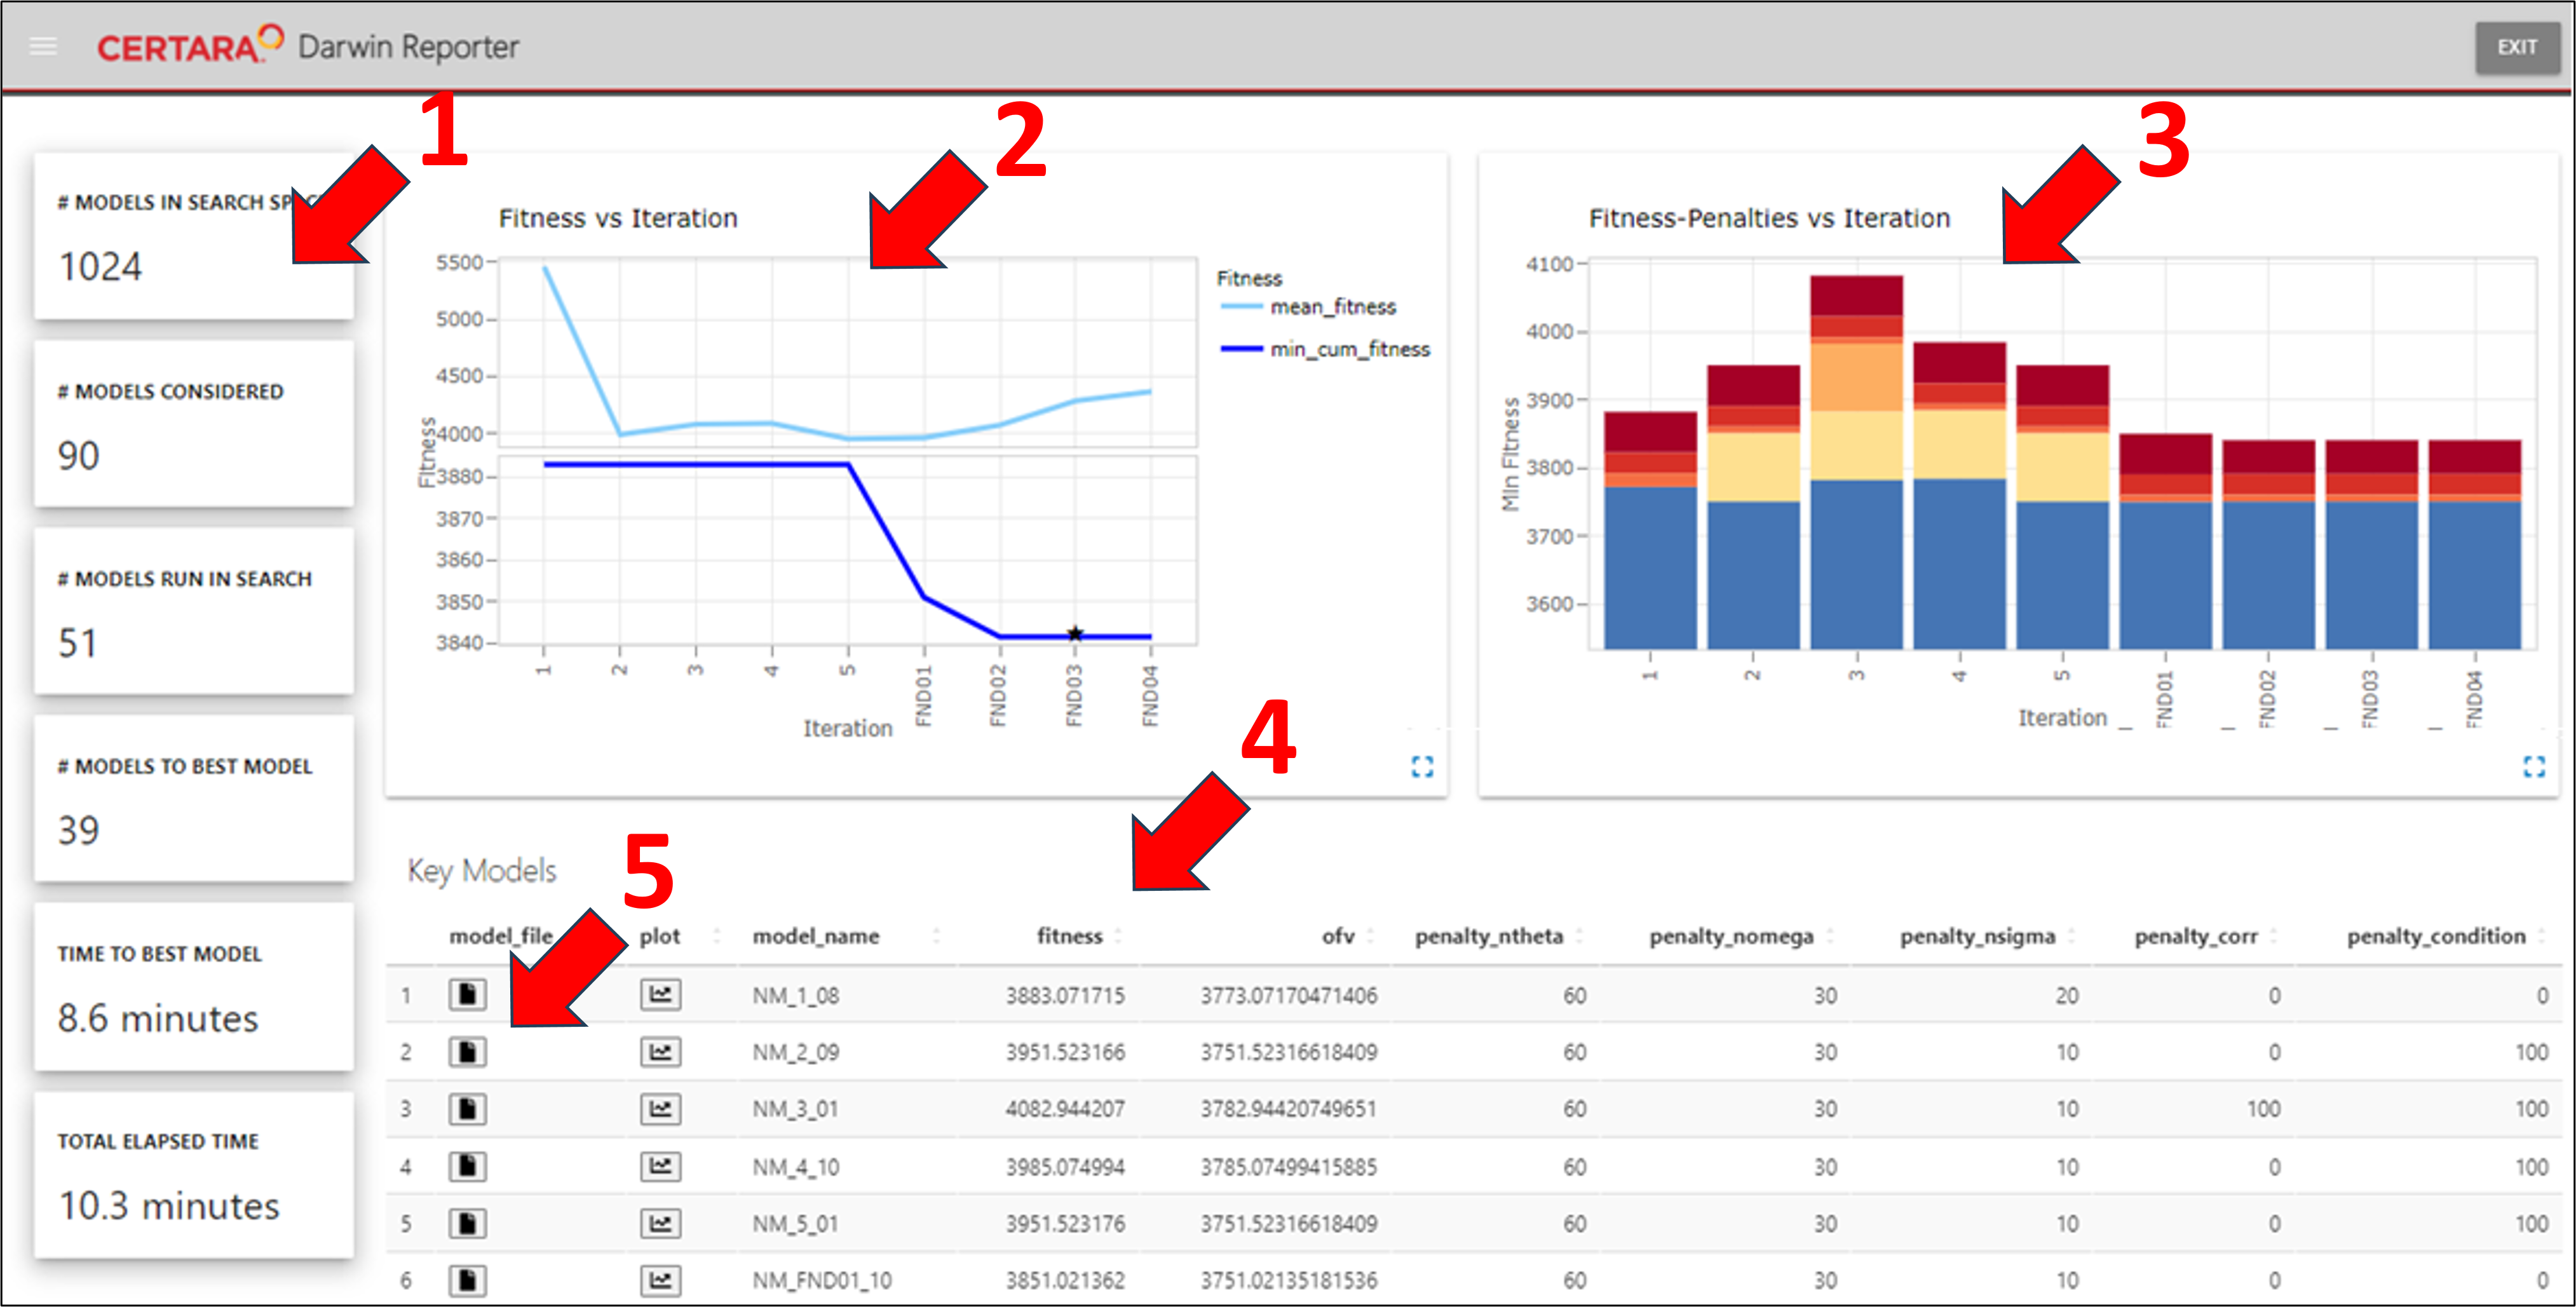
Darwin Reporter provides an overview page of the Darwin Search results that includes:
search details (1)
fitness vs iteration plot (2)
fitness-penalties vs iteration plot (3)
a table of key models found during the search (4)
access to the contents of key model files (5)
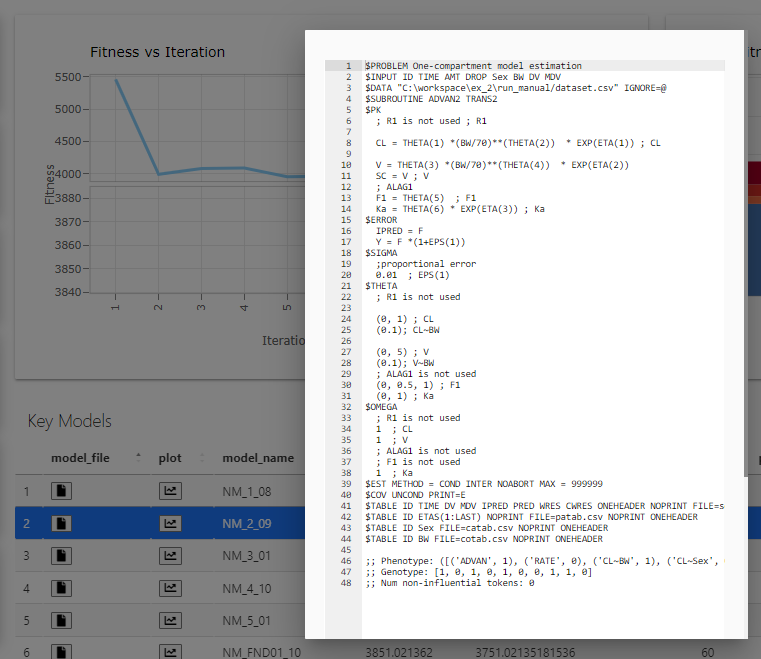
Fitness graphs
Selecting ![]() in the lower-right corner of a plot displays the graph in a popup window.
in the lower-right corner of a plot displays the graph in a popup window.
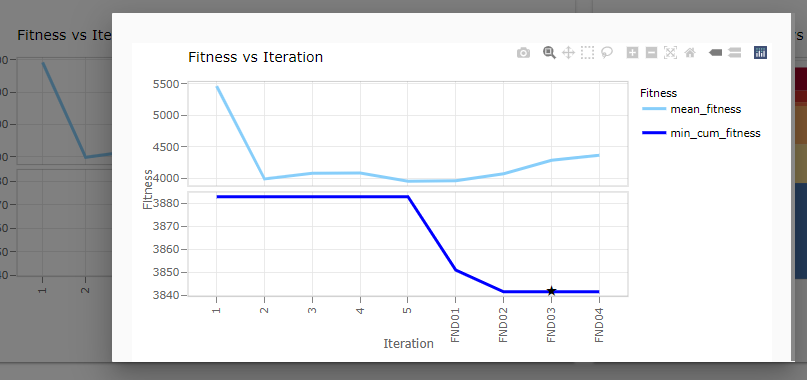
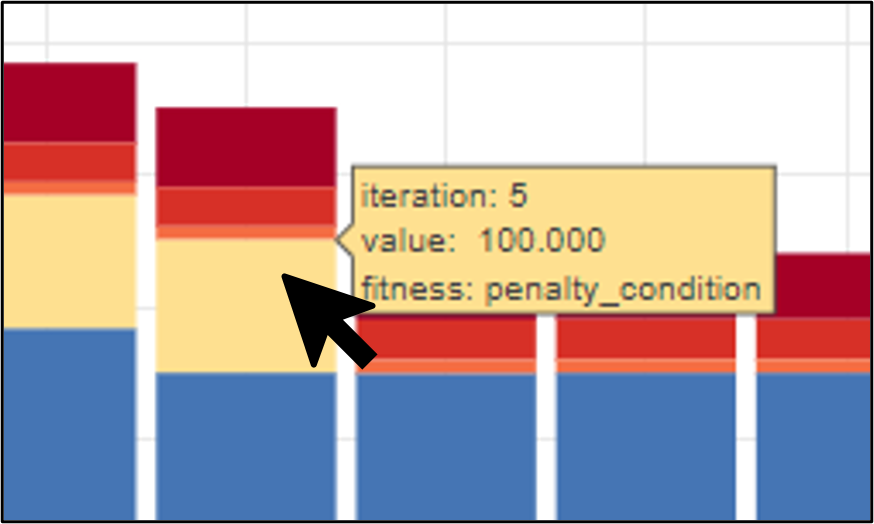
The popup is an interactive plot, so hovering over data points will show a tooltip with details for that point.
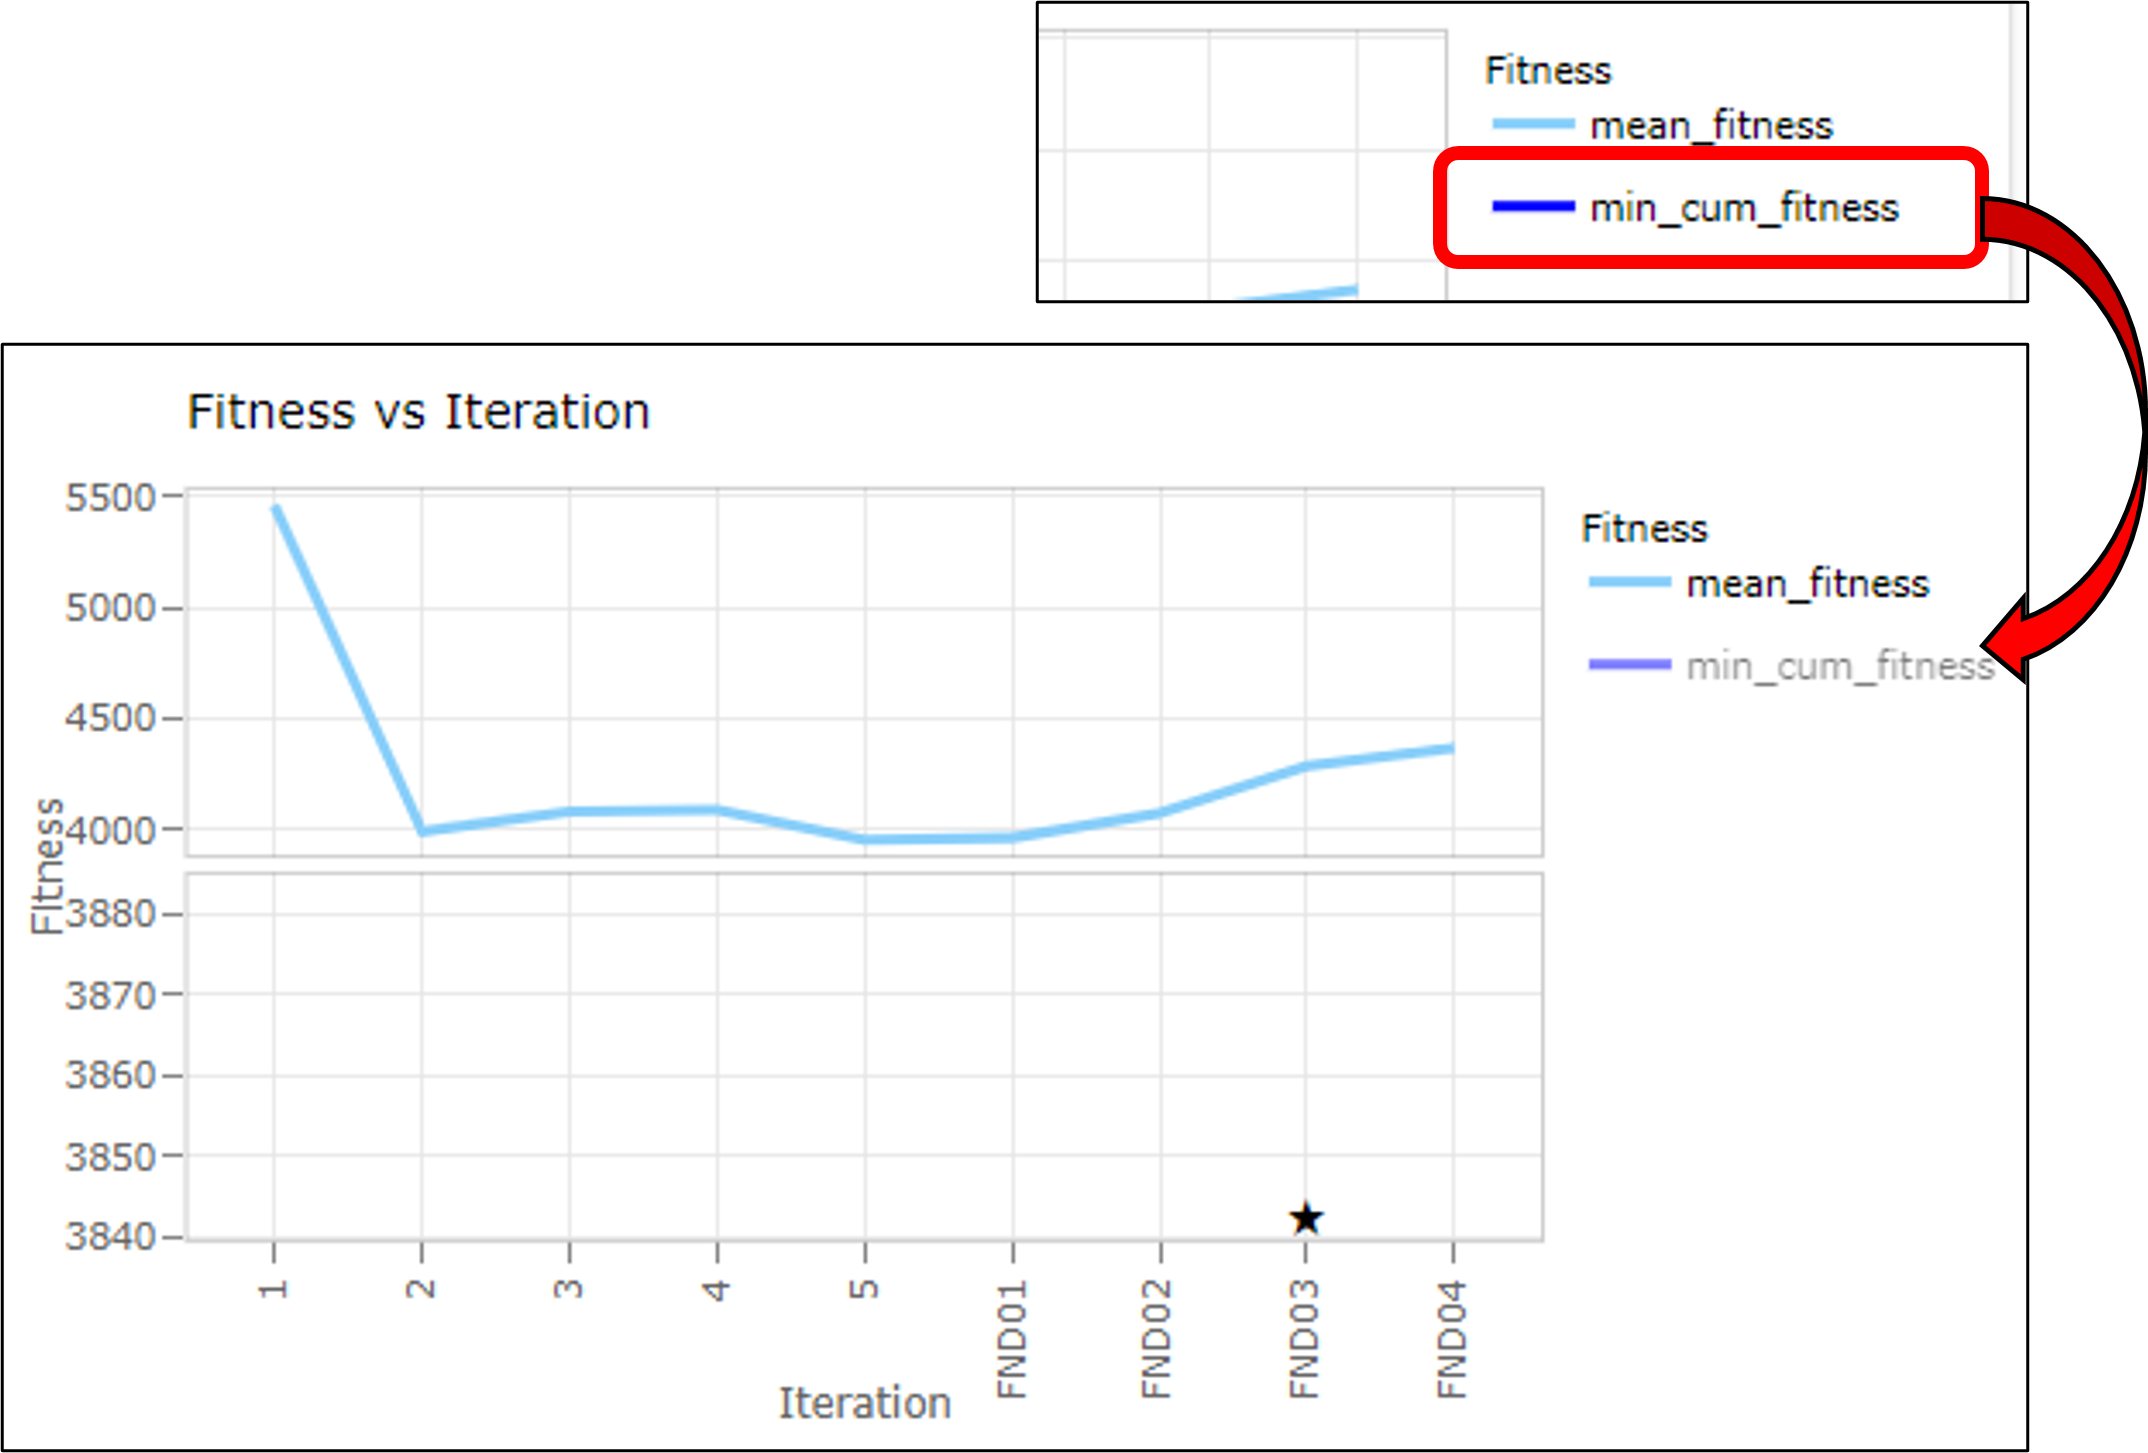
In the Fitness vs. Iteration plot, click an item in the legend to toggle the display of the line.
Key Models table
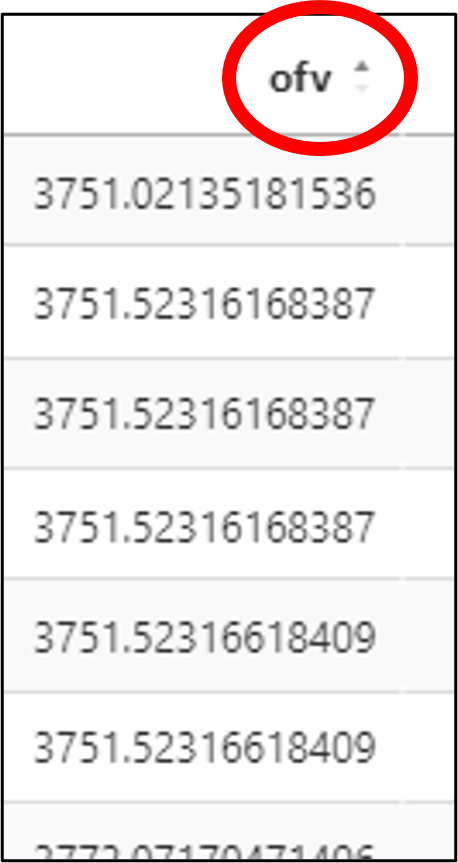
Data in the Key Models table can be sorted by clicking a column header. Click the header multiple times to switch between ascending and descending order. An indicator appears in the header to indicate the direction of sorting.
In the model file column, click ![]() in the desired row to display the contents of the corresponding model file.
in the desired row to display the contents of the corresponding model file.
In the plot column, click ![]() in the desired row to switch to the Diagnostics plots and tables page for that model. (See “Diagnostic plots and tables” for more information.)
in the desired row to switch to the Diagnostics plots and tables page for that model. (See “Diagnostic plots and tables” for more information.)