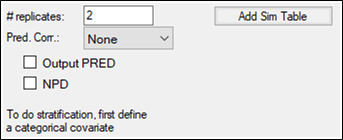
In the # replicates field, enter the number of datasets to sample for the population prediction.
The maximum number of replicates allowed is 10,000. If a larger number is entered, only 10,000 will be generated. The value entered applies to all dependent variables.
Optionally use the Pred. Corr. (Prediction Correction) menu to select the type of correction to use to calculate a prediction-corrected observation.
This option applies to all dependent variables except for discontinuous observed variables (categorical, count, and time-to-event), where this option is ignored.
None: do not apply a correction
Proportional: use the proportional rule.
Additive. use the additive rule.
If either Proportional or Additive are chosen, the following option is presented:
Pred. Variance Corr.: If checked, a prediction-variability corrected observation will be calculated and used in the plots.
Note: If the observations do not typically have a lower bound of zero, the Additive option may be more appropriate.
The Output PRED checkbox is available only when None is chosen in the Pred. Corr. menu. If checked, the population prediction results for continuous observed variables will be shown in the PRED column in the PredCheckAll worksheet.
The NPD checkbox is available only when None is chosen in the Pred. Corr. menu and the model contains continuous observed variables. If checked, simulation-based population prediction (PPRED), normalized prediction discrepancy (NPD), and normalized prediction distribution errors (NPDE) will be included in the Observations worksheet, and the results of observed and simulated quantiles for NPD will be outputted and plotted. This option applies to all observed variables except for discontinuous observed variables (categorical, count, and time-to-event), where this option is ignored.
From the Stratify menu, select a defined categorical covariate to stratify the modeling simulation, if it is needed.
This option is available only when a categorical covariate is defined. Up to three levels of stratification are available and the same stratas are applied for all dependent variables unless they are overridden in the observed variable tab.
Click Add Sim Table to add a simulation table.
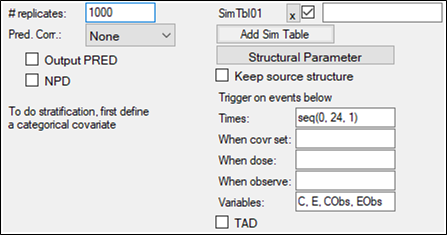
For every simulation table added here, there is a results worksheet generated. called Simulation Table 01 (up to 5). Up to five simulation tables can be added. Unique names for each table can be entered in the field next to the checkbox. These names are NOT used in the simulation results. The options available for a simulation table are the same as those described in the Simple run mode section, except for the following options:
For the Keep source structure, if it is checked, the number of rows output to the table for each simulation replicate is the same as the number of rows in the input datasets.
For the Variables field, any variables (separated by a comma) used in the model can be entered.
For population mode, a worksheet with the results of simulation or a simulation file are loaded into the results: SimulationTable01 or Rawsimtbl01.csv. The simulation file is linked as an external file when it is large and affects performance. The PredCheckAll worksheet contains predictive check simulated data points. All other results correspond to the model fit because Phoenix fits the model before performing simulations.
See “Prediction and Prediction Variance Corrections” for calculation details on prediction and prediction variance corrections.
See “Population weighted residuals, NPD, and NPDE” for details on NPD and NPDE.
See “Simulation options” for details on simulation tables.