Population weighted residuals, NPD, and NPDE
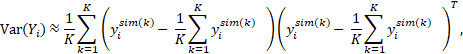
Diagnostic plots based on population and individual predictions are one of the widely used methods for model evaluation. Some of these plots are based on population weighted residuals, which standardize and decorrelate population residuals using the model-predicted variance-covariance matrix of observations. Let 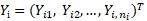 with
with  being the observation for subject i at time
  ,
,  with
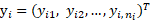
with  being the realization of
  ,
,  , and
, and  respectively represent the expectation and variance-covariance matrix of
  . Then population weighted residuals are defined as:
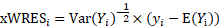
Three methods are often used in the literature to compute  and
and  . One is based on first order (FO) approximation, and the resulting population weighted residuals are called WRES. Another one is based on first-order conditional expectation (FOCE) approximation, and the resulting population weighted residuals are called conditional weighted residuals (CWRES). The last method is based on Monte Carlo simulation:
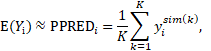
where is the column vector of simulated data obtained at the kth simulation using the model for subject i, and K denotes the number of Monte Carl simulations. The resulting population predictions are called simulation-based population predictions (PPRED), and the resulting population weighted residuals are called predictive check weighted residuals (PCWRES) in Phoenix NLME. Among these three types of population weighted residuals, CWRES and PCWRES have been shown to have better performance than WRES, which may lead to misleading diagnoses, especially in the case where the model is highly nonlinear.
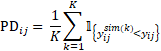
Normalized prediction discrepancy (NPD) and normalized prediction distribution error (NPDE) are another widely used simulation-based metric for model evaluation. The prediction discrepancy (PD) of an observation is defined as its percentile in the predictive distribution (and is called cumulative distribution function of DV, CdfDV, in the Residuals worksheet outputted in Phoenix NLME). It is computed based on Monte Carlo simulation:
NPD is then computed as:
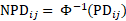
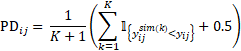
where  denotes the inverse of the cumulative distribution function of the standard normal distribution. We see that if the value of PD is either 0 or 1, an infinity value is obtained for NPD. To prevent this from happening, a slightly different formula is used in Phoenix NLME to compute PD:
The prediction distribution error (PDE) is a decorrelated version of PD (and it is called cumulative distribution function of PCWRES, CdfPCWRES, in the Residuals worksheet outputted in Phoenix NLME). It is computed in the same way as PD but with both simulated and observed data decorrelated:
where  and
and  are computed based on Monte Carlo simulation. NPDE is then computed as:
Again, to avoid infinity value obtained for NPDE, the following formula is used in Phoenix NLME to compute PDE:
By construction, both NPD and NPDE follow a standard normal distribution. It was suggested in the literature that NPD is preferred over NPDE for graphical evaluation as decorrelation can induce artifacts.
References:
Nguyen, T. H. T., Mouksassi, M-S., Holford, N., Al-Huniti, N., Freedman, I., Hooker, A. C., John, J., Karlsson, M. O., Mould, D. R., Pérez Ruixo, J. J., Plan, E. L., Savic, R., van Hasselt, J. G. C., Weber, B., Zhou, C., Comets, E., Mentré, F. (2017). Model Evaluation of Continuous Data Pharmacometric Models: Metrics and Graphics. CPT: Pharmacometrics & Systems Pharmacology, 6(2), 87-109, https://doi.org/10.1002/psp4.12161.