Standard Error (SE) Calculations
The importance of correct standard errors (SE) calculations cannot be overlooked. The SE of the estimated parameters gives an indication of their precision. For example, if the ratio of SE to its corresponding estimate of a parameter is large, it indicates this estimate is not reliable. This may suggest that the model is less sensitive to this parameter or there is overparameterization, or the maximum likelihood has not been really reached. A model will not be informative enough, if the SE of its parameters are not correctly calculated.
When maximal likelihood (ML) is reached, it can be shown that as the number of subjects NSUB reaches infinity asymptotically, the SE of the population parameters ( ) can be calculated using the corresponding covariance matrix [13] [3]
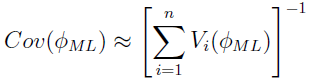
 is called the Fisher score matrix:
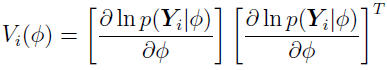
where
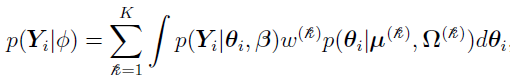
(discussed in “Two-Stage Nonlinear Random Effects Mixture Model”)
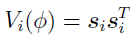
Since  represents the collection of population parameters,
  is actually a column vector that can be denoted as
  , and its transpose is a row vector, so
  is a matrix:
The square root of each diagonal element in  , is the SE of the corresponding parameter in .
Some SEs have analytic solutions, as shown in references [3] and [14].
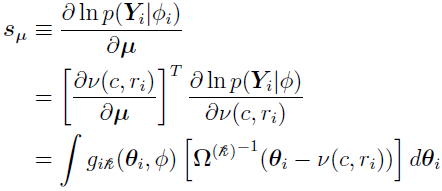
When represents  , then
  can be defined in such that
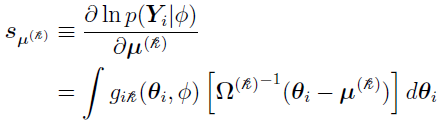
(Refer to Eq. (61) and Eq. (62) and other relevant equations in [15] for quick results of the matrix derivatives.)
When represents  , then
  can be defined in such that
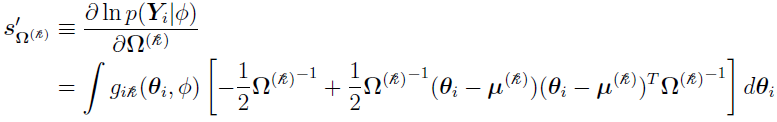
Note that is symmetric, i.e., its off-diagonal (i, j) element  is the same as its (j, i) element
  . In such a case, only the derivative of the independent variables in (those in the lower triangle of ) are of concern. By using the chain rule, for those off-diagonal elements (i > j),
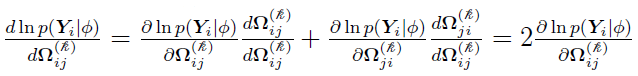
Including the diagonal elements, as shown in reference [3], the full derivative matrix for all the independent lower triangle elements is

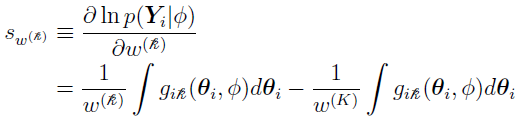
When represents the weight  , there are only K – 1 independent weights since
 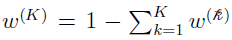 . Therefore, only those derivatives need to be calculated (the SE for
  can be easily obtained by error propagation once the SE is obtained for the other ). So for
  = 1,...,K – 1,
  is
is
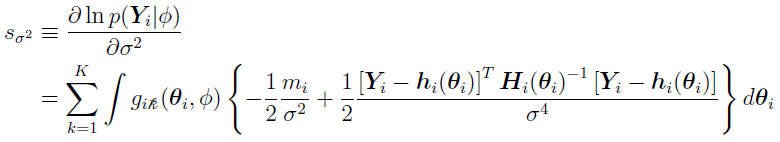
For multiplicative errors, such as 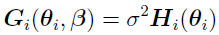 (discussed in “Two-Stage Nonlinear Random Effects Mixture Model”), when represents the variance of the error
  2,
2,
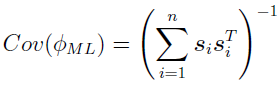
For subject i, once the corresponding 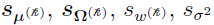 are obtained, arrange all the elements in them into the column vector , and the whole becomes,
For models with covariate parameters, and if the C matrix exists, the SE of the covariate parameters also have closed-form solutions. (If C matrix does not exist, QRPEM will not run.)
Using the model shown in the “C Matrix example” section, for any subject i, its individual Gaussian mean, using the notation from Eq. (4.16) in reference [14], i.e.,  , is a column vector with two rows, and it can be written as
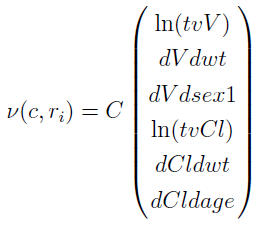
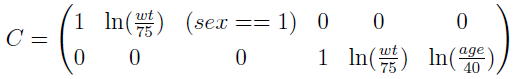
where the C matrix is
For this model, there is no mixture, so K = 1, the population mean is 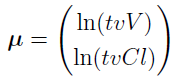 , and the population covariance matrix is
 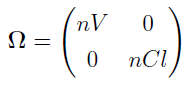 .
.
The  can be calculated from the earlier equation:
In such a model with covariate parameters, can be used instead of , representing the collection of individual parameters 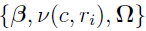 . The calculations can be summarized by Eq. (4.16) in reference [14].
For ln(tvV),
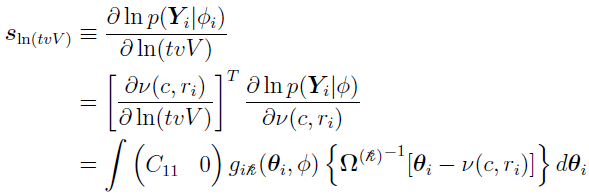
where C11 = 1 is the (1, 1) element of the C matrix.
For ln(tvCl)
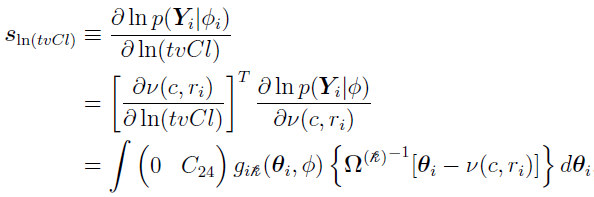
where C24 = 1 is the (2, 4) element of the C matrix.
Since C11 and C24 are always 1, combine the two integrals,
this is similar to the earlier equation: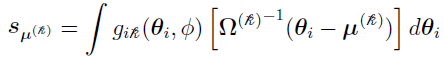
except that is used instead of  here.
here.
For the covariate parameter dVdwt,
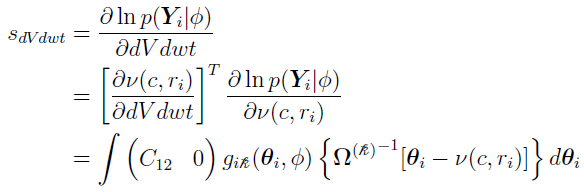
where 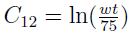 is the (1, 2) element of the C matrix.
For the covariate parameter dVdsex1,
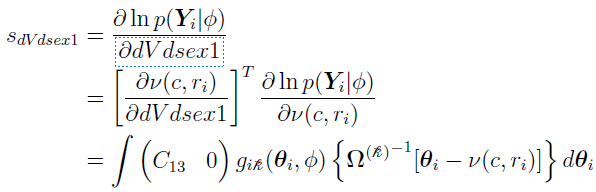
where C13 = (sex == 1) is the (1, 3) element of the C matrix.
For the covariate parameter dCldwt,
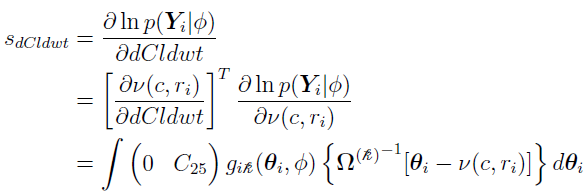
where 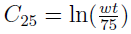 is the (2, 5) element of the C matrix.
For the covariate parameter dCldage,
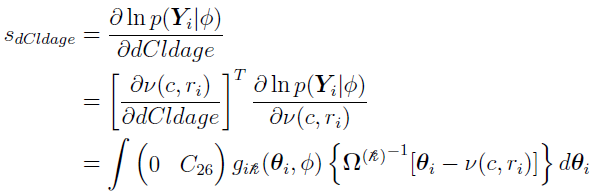
where 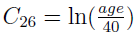 is the (2, 6) element of the C matrix.
Now, for each subject i, arrange  into , and use the following equation (discussed earlier) to obtain the SE for each parameter.
Define ci as
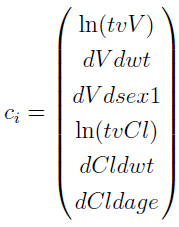
such that 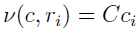 , all the
  can be expressed by the elements in the C matrix.