Before describing the individual controls, it will be helpful to understand the terminology used when discussing the areas of a plot displayed in the Phoenix user interface.
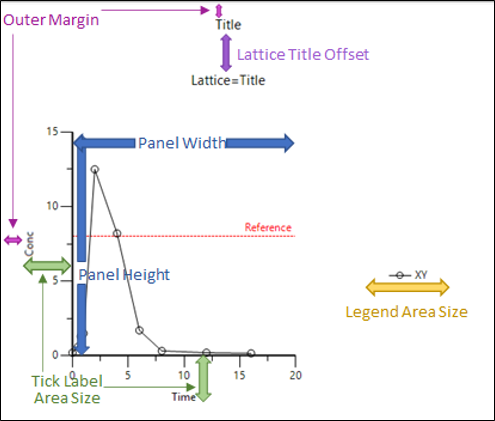
The center of the display is the actual plot itself. This includes the plotted data points, any regression lines or error bars, and the axes lines. Adjusting the panel height and width options will change the size of this area.
The area that encompasses the tick marks, tick labels, and axis labels is called the tick label area.
The outer margin area extends beyond the title and plot provides white space around the plot display.
The legend area is where the plot’s legend is displayed, if specified.
For latticed plots, the space between the plot’s title and the lattice title is referred to as the lattice title offset.
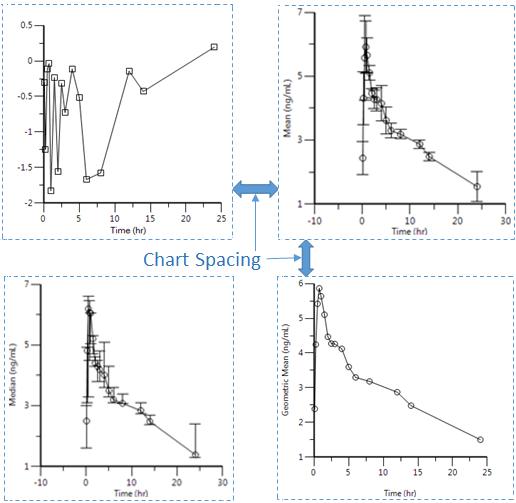
The area between the individual plots that make up a lattice is called chart spacing.
Adjusting the sizes of these areas is available in the Options tab below the display area, select the Layout under the Plot node. There are also controls for setting the appearance of different labels used in a plot. If you find a particular set of values that you would like to use as the default settings, they can be entered in the Plotting Defaults page of the Preferences dialog (Edit > Preferences). See the “Plotting defaults” section for more details.