The Plotting Defaults page of the Preferences dialog allows adjusting a number of display settings that will be used as the defaults for plots. The settings in this dialog apply to the output of Plotting objects, as well as to any plots created from other operational objects, such as NCA. They do not override any user-specified settings in projects.
In the Preferences dialog, select Plotting Defaults.
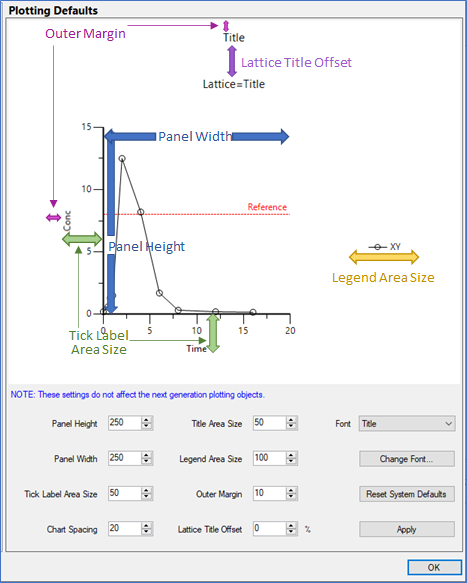
In the fields, type the appropriate value or use the arrow buttons.
Panel Height and Panel Width: The size of the plot drawing area.
Tick Label Area Size: How wide the tick label area is from the axes.
Chart Spacing: The distance between multiple graphs.
Title Area Size: How wide the area is where the title is displayed.
Legend Area Size: How wide the area is for the legend.
Outer Margin: The size of the space between the graph title and the tick label area.
Lattice Title Offset: Distance to shift the Lattice Title from the graphs in the lattice.
Select the item whose font is to be changed from the Font menu.
Press Change Font to display the Font dialog for modifying the selected item’s font, size, style, etc.
Press Reset System Defaults to change all settings on the page to the Phoenix system default values.
Press Apply to save the settings as the plot defaults.
Note: When saving a project, only those plot settings that have been changed in the user interface will be saved with the project. Any settings that have not been modified in the interface will not be saved with project, as the default plot settings will be applied when the project is reopened.