Refer to the “Terminology of a plot display” section for a review of the various areas that make up a plot.
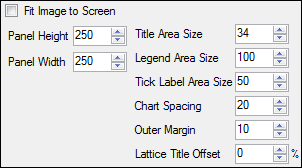
Select Plot > Layout in the tree.

Check the Fit image to screen box to force the plot image to fit the current size of the right viewing panel.
Note: Selecting Fit image to screen disables all other options in the Layout tab.
For the following fields, select or type the number of pixels to use.
If a value is entered that is larger than what can be used in the plot display panel, then Phoenix automatically changes the value to the maximum possible and adjusts the other values as necessary.
Panel Height: Plot height.
Panel Width: Plot width.
Title Area Size: Title area of the plots. Setting the value too low can cause the title to get cropped.
Legend Area Size: Legend area. The Scatter Plot Matrix object does not use this control.
Tick Label Area Size: Tick label area.
Chart Spacing: Distance between plots.
Outer Margin: Margin around the plots.
In the Lattice Title Offset field select or type the percent to offset the lattice title from the plots.