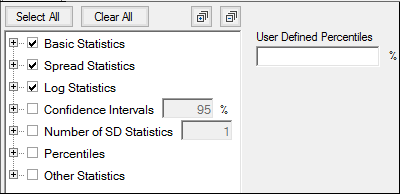
See “Available statistics” for a full list of the available statistics.

Check the corresponding box in the tree to select statistics to compute and include in the report.
Statistics are grouped into categories and checking/unchecking a category controls all statistics within that category. For example, unchecking the Spread Statistics box unchecks the Min, Median, Max, and Range checkboxes.
Press Select All or Clear All to quickly check/uncheck all boxes in the list, respectively, with a single click.
Click the ![]() or
or  icons to expand/collapse all categories in the tree, respectively.
There are several preset percentiles available in the Percentiles category (1, 2.5, 5, 10, 25, 50, 75, 90, 95, 97.5, 99). However, To include other percentiles, enter them as a comma-separated list in the User Defined Percentiles field.
To generate confidence interval statistics, type the desired confidence interval in the Confidence Interval field.
Check the Confidence Intervals box to compute all confidence interval-related statistics or click + to expand the list and select a subset.
To generate standard deviation statistics, type the desired number of standard deviations (between 1 and 10, inclusively) in the Number of SD Statistics field.
Check the Number of SD Statistics box to compute all SD-related statistics or click + to expand the list and select a subset.