The Ratios and Differences tool in Phoenix is a data manipulation tool that is used to compare data from either one or two worksheets by computing ratios or differences. The computations are based on sort variables and on a variable that defines how data values are to be used as the X values and Y values of the ratios or differences. In Pharmacokinetics, ratios are often computed for observation data collected under two different scenarios and for resulting final parameters from two NCA or Modeling executions. For discrete final parameters or log-transformed observation data, differences may be applicable instead of ratios.
Use one of the following to add the object to a Workflow:
Right-click menu for a Workflow object: New > Computation Tools > Ratios and Differences.
Main menu: Insert > Computation Tools > Ratios and Differences.
Right-click menu for a worksheet: Send To > Computation Tools > Ratios and Differences.
Note:To view the object in its own window, select it in the Object Browser and double-click it or press ENTER. All instructions for setting up and execution are the same whether the object is viewed in its own window or in Phoenix view.
Additional information is available on the following topics:
User interface description
Results
See “Analysis of three profiles using NCA” for an example of using the Ratios and Differences object.
Worksheet 1 and 2 Mappings panel
Sort Map Mappings panel
Options tab
Worksheet 1 and 2 Mappings panel
Use the Worksheet Mappings panels to identify how input variables are used in the object.
Sort: (Optional) Categorical variable(s) identifying individual data profiles, such as subject ID or gender. Separate computations are computed for each unique combination of sort variables. When no Sorts are identified for a worksheet, the input is assumed to be from one profile.
Filter: (Optional) Column containing the X/Y filter value. This column is a special case of a sort variable that is used to split or filter the data into subsets, and the subsets are used to define which data (in another column) is to be used for X (the numerator in the case of ratios) and which data (in another column) is for Y (the denominator in the case of ratios). For example, a column named Day, which contains the values Day 1 and Day 14, is mapped as the Filter, and Day 14 will be used to filter for the rows where data in other columns will be used as numerator values, and similarly Day 1 will be used to filter for the rows where data in other columns will be used as denominator values. If Filter is not mapped, then only the Sort(s) are used to split the data.
Carry: (Optional) Columns from the source worksheet will be copied to the result worksheet.
Note:If no Sort or Filter is mapped, then this defines a special case where the X and Y columns will be required to be different columns (either on one worksheet or from two worksheets), and the Ratios and Differences object will compute the X/Y ratios (or differences) row-by-row.
If a second worksheet is used, then the Sort Map worksheet may be needed to map the column names of Worksheet 1 and Worksheet 2, if they differ. This will allow rows in both worksheets to be merged based on their sort keys. The Worksheet 1 Sort Keys and Worksheet 2 Sort Keys pull-down menus are populated with the names of the columns defined as Sort keys on each worksheet’s mapping panel. Required input is highlighted orange in the interface.
The Sort Map will automatically map columns of the same name. If there is not a matching name for a Worksheet 1 column, the Worksheet 2 column name will be blank.
The Options tab is used to define the ratio and/or difference calculations that will be executed at runtime. Additional rows may be added by pressing the Add button, which becomes active once the input for Worksheet 1 is specified.
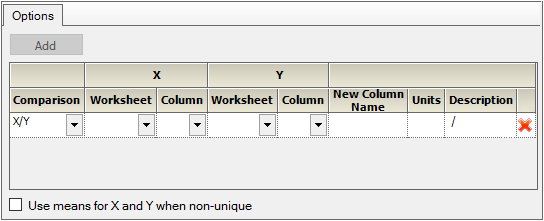
Comparison: The type of operation to be performed on X and Y, either X/Y or X – Y.
X or Y Worksheet: The worksheet to be used as the source for X or Y, respectively. Choose from either Worksheet 1 or Worksheet 2. Only displayed if more than one worksheet is specified as input for the object.
X or Y Column: Name of the column in the X or Y Worksheet that contains the values to be used as X or Y, respectively.
X or Y Filter Value: If a column is mapped to the optional Filter context, select the value to use to filter for data values in other columns in order to find the X or Y values to use in the ratios. For example, a column named Day is mapped to the Filter context, which contains the values Day 1 and Day 14. The user selects Day 14 for the X option and Day 1 for the Y option in order to compute ratios of data on Day 14 over data on Day 1, for each Sort level.
The list of values to define X also includes All, which will create multiple sets of ratios or differences using all values in the X Filter column that are different from the specified Y Filter Value, to define the X’s. Continuing the example, suppose the column Day contains Day 1, Day 14, and Day 28. The user selects All for the X option and Day 1 for the Y option. Ratios would be computed for each Sort level for Day 14 over Day 1 and for Day 28 over Day 1. Another example is comparing all metabolites to the parent drug.
New Column Name: Displays the name of the column that will contain the results of the specified operation on X and Y. The default name is created using the format:
[Ratio or Diff]_[X column name][X filter value]_[Y column name][Y filter value]
Units: The user-specified units of the comparison. Note: These units are NOT used during the calculation execution; they are only labels.
Description: A read-only textual representation of the calculation. The format is:
[Worksheet 1].[X column][ where Filter=X filter value] [“/” | ”–”] [Worksheet 2].[Y column] ][ where Filter=y filter value]
Defined calculations can be deleted by pressing the red “X” on the row to be deleted.
If the Sort(s) and Filters do not split the X and Y data into unique values for X and Y, check the Use means for X and Y when non-unique box to calculate the mean of the X values and the mean of the Y values, and use the calculated means in the specified ratio or difference. If unchecked, and the values for a profile are not unique, an error message will be given.
In the stacked results worksheet(s), mapped columns are listed first, followed by parameter data columns used in the comparison computation, then the ratio/difference columns, and then the Carry variables.
Cells in the comparison columns will be empty for the X input worksheet data or if the Filter column is used and its value is the same as the X value.
The unstacked results worksheet(s), the X values, Y values, and ratios (or differences) are listed side-by-side, for each defined comparison, followed by the Carry variables.
Settings: The input worksheet used and the options selected.
Warnings and Errors: If any runtime errors are encountered, they are written to this file.
