The Legend menu allows users to change the formatting and display properties. A legend is created in the plot display panel for each plot page tab.
Selecting the Legend menu provides access to the following tabs of controls.
Select Legend in the tree to access the legend Appearance tab.
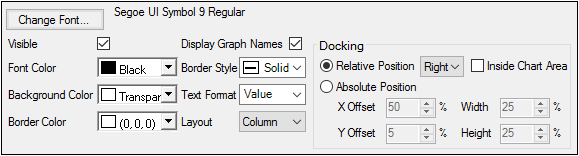
The Legend Appearance tab allows users to specify how the legend is displayed for each plot or group of plots. All plot objects share a common set of legend formatting controls.
Click the Change Font button to open the Font dialog and change the legend font.
Use the Visible checkbox to toggle display of the legend in the plot.
In the menus for Font Color, Background Color, and Border Color, use one of the three tabs (Palette, Named, or System) to select the color.
Use the Display Graph Names checkbox to toggle display of plot names in the Legend.
If no variable is mapped to the Group context, then the only information in the Legend is the plot name. In this case, clearing the Display Graph Names checkbox has the same effect as clearing the Visible checkbox because the legend is removed from the plot display panel.
In the Border Style menu, select the legend border line style.
In the Text Format menu, select the legend label format:
Value: Only values of variable(s) mapped to the Group context are displayed in the legend.
Name: Value: The name of variable(s) mapped to the Group context is displayed with the corresponding value in the legend.
In the Layout menu, select the how the legend items are to be listed:
Column: List all legend items as a single column.
Row: List all legend items as a single row.
Table: List legend items as a table (multiple rows and columns).
In the Docking area, select whether to use relative or absolute positioning to place the legend with respect to the plots.
Relative Position: Use the menu to specify the relative position (Top, Right, Bottom, Left). Check the Inside Chart Area checkbox to move the legend inside the area defined by the two axes.
Absolute Position: Enter the percentage from the left edge of the display (X Offset) and from the top edge of the display (Y Offset) to position the legend. Use the Width and Height fields to adjust the size of the legend area as a percentage of the display area.
Note:The Inside Chart Area checkbox and Absolute Position options are not available for latticed plots, unless latticed only by page (one plot per page).
The Order tab is available only when at least one Group is mapped for an XY, X-Categorical XY, Bar, Column, or Box plot.
Select Legend in the tree to access the legend Order tab.
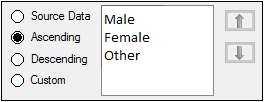
The available Group values are displayed in the list. The order in which the values appear in the legend is specified by selecting one of the following:
Source Data: Order the values as they appear in the source data.
Ascending: Order the values from least to greatest.
Descending: Order the values from greatest to least.
Custom: Select a value and use the arrows to arrange the values to the desired order.
