The X, Y, and Y2 menu items set the appearance of the plot axes. The Box Plot and Histogram objects only have a Y context, but they do have X and Y axes. Select the X or Y menu items to set the appearance of the plot axes. The Scatter Plot object will list an axis item for each variable mapped to the Included context.
Select one of the axis menu items to access the following tabs:
-
Content tab, see:
“Set the axis range”
“Set the axis scale” -
Appearance tab, see “Define axis and tick mark appearance”
-
Axis Label tab, see “Format the axis label”
-
Order tab, see “Order categorical axes”
Select Axes > X, Y, or Y2 in the tree, then click the Content tab.
Options for setting the range are fairly consistent across plot objects.
Axis Options — Content tab
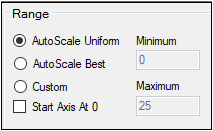
There are two autoscaling methods available for determining the axis range.
AutoScale Uniform creates a uniform axis scale across all plots when multiple pages, rows, or columns are used to show the plots. This is the default setting. Note that, in some plots, this option can cause the axis to extend past the highest data point or below the lowest point, since the largest range needed is used. (This option does not apply to Scatter Plot Matrix.)
AutoScale Best allows Phoenix to determine the best axis scale based on the number of data points and the values used to create each individual plot. This is the default setting for the X-axis when the X-axis is categorical (X-Categorical XY, Box, Bar, and Column plot objects).
Note:Both Auto-scale options use the highest and lowest data points mapped to the axis to create the scale, where the first option uses the highest and lowest points from all plots in the lattice, and the second option uses the highest and lowest points for each individual plot.
For axes that are continuous, if either auto-scale option is selected and Linear scaling is specified, the Start Axis At 0 checkbox becomes available. When checked, this option forces the axis numbering to start at 0, regardless of the data being plotted.
A Custom option allows manual entering the range for the axis. This option is available for the Y- and Y2-axes for all plot objects and the X-axis for QQ, Scatter Plot Matrix, and XY Plots.
-
Enter the starting point (i.e., the lowest value on the axis) in the Minimum field.
-
In the Maximum field, type the end point (i.e., highest value on the axis).
-
Use the Divisions options to specify the number of tick marks that appear on the axis.
In the Major field, enter the number of numerically-labeled tick marks to display on the axis.
In the Minor field, enter the number of unlabeled tick marks to appear the axis.
Select Axes > X, Y, or Y2 in the tree, then click the Content tab.
Scaling is available for the X-. Y- and Y2-axes for all plot objects and the X-axis for QQ, Scatter Plot Matrix, and XY Plots.
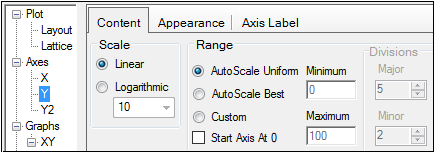
Select whether to perform Linear (default) or Logarithmic scaling of the axis.
If Logarithmic is specified, select the logarithmic base. Options include: 2, 10, e (base of the natural logarithm).
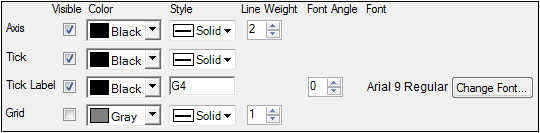
Define axis and tick mark appearance
Select Axes > X, Y, or Y2 in the tree, then click the Appearance tab.
Scatter Plot Axis Options — Appearance tab
Clear the Visible checkbox to remove the corresponding item from the plot.
Clearing this checkbox for Axis disables all other axis and tick mark formatting controls in the Appearance tab.
Use the Color menu to set the color. Choose one of the color scheme tabs: Palette, Named, or System and click the color.
Select the line style for the axis, ticks, and grids from the Style menu
Enter the format for the tick label in the Tick Label Style field.
The default is G4. G is the Microsoft .NET general format used for displaying real numbers in decimal form. Using the G format converts a number to either fixed-point or scientific notation, depending on the length of the number and the specified precision. The 4 indicates that four numbers can be displayed on axis tick marks.
Users can enter their own custom format using the following characters:
G4: The default format. Can be changed to display numbers longer than four digits. (Usage: G5, G6, etc.)
0: Displays the whole number. (Usage: 0)
0.00: Displays the whole number plus two decimal places. (Usage: 0.00)
#: The pound sign is used as a digit placeholder. The digit is displayed if it exists, and is blank otherwise. 0 and # can be combined, 0 for required digits and # for optional digits. (Usage: #.##, 0.0####)
.: Decimal point. (Usage: #.##)
,: Thousand separator. (Usage: #,###.##; #,##0; #,##0.00)
%: Percentage sign. (Usage: #.##%; 0%; 0.0%)
E0; E+0; E–0: Entering any of these characters will cause the scale ticks to be formatted using scientific notation. (Usage: #.##E0; #.##E+0; #.##E–0)
ABC: Plain text characters are displayed literally. (Usage: Hello world)
Note:Standard and custom .NET numeric formats are supported for labels. Full specifications can be found at:
– Standard numeric format strings: https://docs.microsoft.com/en-us/dotnet/standard/base-types/standard-numeric-format-strings
– Custom numeric format strings: https://docs.microsoft.com/en-us/dotnet/standard/base-types/custom-numeric-format-strings
Select or type the thickness of the axis or grid lines in the Line Weight field.
For tick labels, use the Font Angle field to specify how far to rotate the tick labels (in degrees). The range of valid angle values is from –90 to 90.
For axis and tick labels, click the Change Font button to open the Font dialog. Select the font type, style, size, effect, and script for the label and click OK.
Select Axes > X, Y, or Y2 in the tree, then click the Axis Label tab.
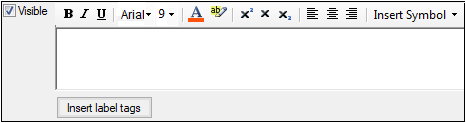
Clear the Visible checkbox to remove the axis label from the plot.
Type a title for the axis in the text field. Axis titles are automatically assigned based on the column header and units of the variable mapped to the axis.
Use the tools to customize the format of the text.
In the Insert Symbol menu, select Greek letters to insert in the axis title. Users can select any lowercase or uppercase Greek letters except zeta, eta, kappa, xi, rho, and upsilon.
Click the Insert label tags button to enter place holder text into the label which Phoenix will replace with the mapped value. The place holder labels are:
<x:#> for the x column names
<xunit:#> for the x column units
<y:#> for the y column names
<yunit:#> for the y column units
The # is replaced by the number corresponding to the graph (generally one unless the user has overlaid multiple graphs).
Select Axes > X in the tree, then click the Order tab.
Note:The Order tab is available only for the X axis of X-Categorical XY, Bar, Column, and Box plots.
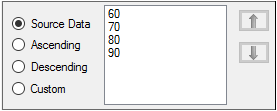
The available X axis values are displayed in the list. The order in which the values appear along the X axis of the plot is specified by selecting one of the following:
Source Data: Order the values as they appear in the source data.
Ascending: Order the values from least to greatest.
Descending: Order the values from greatest to least.
Custom: Select a value and use the arrows to arrange the values to the desired order.
