The Annotations tab allows users to annotate the graph. Annotations can be dragged and dropped anywhere within the graph area.
Select Annotations in the tree to access the Annotations tab.
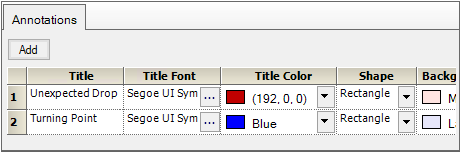
Click Add to add a row in the table.
In the Title column, type the annotation text.
Click […] in the Font column to display the Font dialog for changing the format of the text (font, font size, font style, and effects).
In the Title Color menu, select the annotation color by selecting a color scheme tab: Palette, Named, or System and clicking the color.
In the Shape column, select shape to use for the annotation text area.
In the Background Color column, select the color behind the annotation text by selecting a color scheme tab: Palette, Named, or System and clicking the color.
In the Border Style menu, select the style of border for the annotation area.
In the Border Color column, select the color for the annotation border.
In the Border Width column, select or enter the width of the annotation border.
To remove an annotation, click the red X in the corresponding row in the table.
