See also “NCA models” and, for additional reading, see “References”.
Data structure: NCA for blood concentration data requires the following input data:
•Time of each sample
•Plasma or serum concentrations
Output: Models 200–202 estimate the parameters in the following tables.
|
Parameter |
Description |
|
Dosing time |
Available as ‘Time’ in the Dosing Used results. |
|
N_Samples |
This parameter reports the number of non-missing observations used in the analysis of the profile (time is at or after dosing time, the observation is numeric, and the volume is positive for urine models). |
|
Dose |
Amount of last administered dose. |
|
No_points_Lambda_z |
Number of points used in computing Lambda Z. |
|
Tlag |
Time of observation prior to the first observation with a measurable (non-zero) concentration. |
|
Tmax |
Time of maximum observed concentration. |
|
Cmax |
Maximum observed concentration, occurring at time Tmax, as defined above. |
|
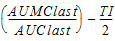
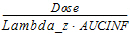
Cmax_D |
= |
|
C0 |
Initial concentration. Given only for IV Bolus dosing. |
|
Tlast |
Time of last measurable (positive) observed concentration. |
|
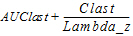
Clast |
Observed concentration corresponding to Tlast. |
|
AUClast |
Area under the curve from the time of dosing to the time of the last measurable (positive) concentration (Tlast). |
|
AUClast_D |
= |
|
AUCall |
Area under the curve from the time of dosing to the time of the last observation. |
|
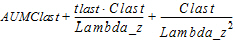
AUMClast |
Area under the moment curve from the time of dosing to the last measurable (positive) concentration. |
|
MRTlast |
Mean residence time from the time of dosing to the time of the last measurable concentration. |


The following table includes several parameters that are extrapolated to infinity. These parameters are calculated two ways: based on the last observed concentration (indicated by “_obs” appended to the parameter name), or based on the last predicted concentration (indicated by “_pred” appended to the parameter name), where the predicted value is based on the linear regression performed to estimate Lambda Z.
|
Parameter |
Description |
|
Rsq |
Goodness of fit statistic for the terminal elimination phase. |
|
Rsq_adjusted |
Goodness of fit statistic for the terminal elimination phase, adjusted for the number of points used in the estimation of Lambda Z. |
|
Corr_XY |
Correlation between time (X) and log concentration (Y) for the points used in the estimation of Lambda Z. |
|
Lambda_z |
First-order rate constant associated with the terminal (log-linear) portion of the curve. |
|
Lambda_z_intercept |
Intercept on log scale estimated via linear regression of time vs. log concentration. |
|
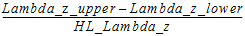
Lambda_z_lower |
Lower limit on time for values to be included in the calculation of Lambda Z. |
|
Lambda_z_upper |
Upper limit on time for values to be included in the calculation of Lambda Z. |
|
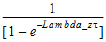
HL_Lambda_z |
Terminal half-life= |
|
Span |
= |
|
Clast_pred |
Predicted concentration at Tlast: |
|
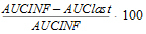
AUCINF(_obs, _pred) |
AUC from time of dosing extrapolated to infinity, based on the last observed concentration (_obs) or last predicted concentration (_pred). |
|
AUCINF_D(_obs, _pred) |
= |
|
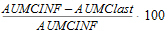
AUC_%Extrap(_obs, _pred) |
Percentage of AUCINF(_obs, _pred) due to extrapolation from Tlast to infinity: |
|
Computed for IV Bolus models. Percentage of AUCINF that was due to back extrapolation to estimate C0 when the first measured concentration is not at dosing time. |
|
|
Vz(_obs, _pred) Vz_F(_obs, _pred)a |
Volume of distribution based on the terminal phase. |
|
Cl(_obs, _pred) Cl_F(_obs, _pred)a |
Total body clearance for extravascular administration. |
|
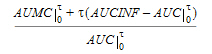
AUMCINF(_obs, _pred) |
Area under the first moment curve (AUMC) extrapolated to infinity, based on the last observed concentration (obs) or the last predicted concentration (pred). |
|
AUMC_%Extrap(_obs, _pred) |
Percent of AUMCINF(_obs, _pred) that is extrapolated. |
|
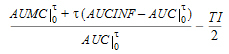
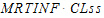
MRTINF(_obs, _pred) |
Mean residence time (MRT) extrapolated to infinity. For non-steady-state data: |
|
Vss(_obs, _pred) |
For non-steady-state data: An estimate of the volume of distribution at steady-state based on the last observed (obs) or last predicted (pred) concentration. |


|
aFor extravascular models (model 200), the fraction of dose absorbed cannot be estimated; therefore Volume and Clearance for these models are actually Volume/F or Clearance/F where F is the fraction of dose absorbed. |
|
Parameter |
Description |
|
Tau |
Available in the Dosing Used results worksheet for steady-state data. |
|
Tmax |
Time of maximum observed concentration. |
|
Cmax |
Maximum observed concentration, occurring at time Tmax, as defined above. |
|
Tmin |
Time of minimum observed concentration. |
|
Cmin |
Minimum observed concentration occurring at time Tmin as defined above. |
|
Ctau |
Concentration at dosing time plus Tau. |
|
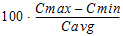
Cavg |
Average concentration, computed: |
|
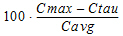
Swing |
= |
|
Swing_Tau |
= |
|
Fluctuation% |
= |
|
Fluctuation%_Tau |
= |
|
CLss, CLss_Fa |
An estimate of the total body clearance, computed for IV Bolus and Infusion dosing only. |
|
MRTINF(_obs, _pred) |
Mean residence time (MRT) extrapolated to infinity based on AUCINF(_obs, _pred). |
|
Vz, Vz_Fa |
= |
|
Vss(_obs, _pred) |
An estimate of the volume of distribution at steady-state based on the last observed (obs) or last predicted (pred) concentration. |
|
Accumulation Index |
= |
|
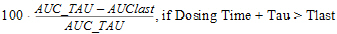
AUC_TAU |
The partial area from dosing time to dosing time plus Tau. |
|
AUC_TAU_D |
= |
|
AUC_TAU_%Extrap |
Percentage of AUC_TAU that is due to extrapolation from Tlast to infinity. |
|
AUMC_TAU |
Area under the first moment curve from dosing time to dosing time plus Tau. |
|
AUClower_upper |
(Optional) User-requested area(s) under the curve from time “lower” to “upper”. |


|
aFor extravascular models (model 200), the fraction of dose absorbed cannot be estimated; therefore Volume and Clearance for these models are actually Volume/F or Clearance/F where F is the fraction of dose absorbed. |
Data structure: NCA for urine data requires the following input data:
•Starting and ending time of each urine collection interval
•Urine concentrations
•Urine volumes
From this data, models 210–212 compute the following for the analysis:
•Midpoint of each collection interval=(Starting time+Ending time)/2
•Excretion rate for each interval (amount eliminated per unit of time)=(Concentration*Volume)/(Ending time-Starting time)
Output: Models 210–212 estimate the following parameters.
The worksheet will include the Sort(s), Carry(ies), parameter names, units, and computed values. A User Defined Parameters Pivoted worksheet will include the pivoted form of the User Defined Parameters worksheet.
|
Parameter |
Description |
|
Dosing time |
Available as ‘Time’ in the Dosing Used results. |
|
Dose |
Amount of last administered dose. |
|
N_Samples |
Number of non-missing observations in the analysis. |
|
No_points_lambda_z |
Number of points used in the computation of Lambda Z. |
|
Tlag |
Midpoint of the collection interval prior to the first collection interval with measurable (non-zero) rate. |
|
Tmax_Rate |
Midpoint of the collection interval associated with the maximum observed excretion rate. |
|
Max_Rate |
Maximum observed excretion rate, at time Tmax_Rate as defined above. |
|
Mid_Pt_last |
Midpoint of collection interval associated with last measurable (positive) observed excretion rate. |
|
Rate_last |
Last observed measurable (positive) rate at time Mid_Pt_last. |
|
AURC_last |
Area under the urinary excretion rate curve from time of dosing to Mid_Pt_last. |
|
AURC_last_D |
= |
|
Vol_UR |
Sum of Urine Volumes (urine) |
|
Amount_Recovered |
Cumulative amount eliminated. |
|
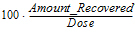
Percent_Recovered |
= |
|
AURC_all |
Area under the urinary excretion rate curve from the time of dosing to the midpoint of the interval with the last rate. |

The following table includes some parameters that are extrapolated to infinity. These parameters are calculated two ways: based on the last observed excretion rate: Rate_last (indicated by “_obs” appended to the parameter name), or based on the last predicted excretion rate: Rate_last_pred (indicated by “_pred” appended to the parameter name), where the predicted value is based on the linear regression performed to estimate Lambda Z.
|
Parameter |
Description |
|
Rsq |
Goodness of fit statistic for the terminal elimination phase. |
|
Rsq_adjusted |
Goodness of fit statistic for the terminal elimination phase, adjusted for the number of points used in the estimation of Lambda Z. |
|
Corr_XY |
Correlation between midpoints and log excretion rates for the points used in the estimation of Lambda Z. |
|
Lambda_z |
First-order rate constant associated with the terminal (log-linear) portion of the curve. |
|
Lambda_z_intercept |
Intercept on log scale estimated via linear regression of midpoints vs. log excretion rates. |
|
Lambda_z_lower |
Lower limit on midpoint for values to be included in Lambda Z estimation. |
|
Lambda_z_upper |
Upper limit on midpoint for values to be included in Lambda Z estimation. |
|
HL_Lambda_z |
Terminal half-life=ln(2)/Lambda Z |
|
Span |
= |
|
Rate_last_pred |
Predicted rate at Mid_Pt_last. |
|
AURC_INF(_obs, _pred) |
Area under the urinary excretion rate curve extrapolated to infinity, based on the last observed excretion rate (_obs) or the last predicted rate (_pred), i.e., the excretion rate at the final midpoint estimated using the linear regression for Lambda Z. |
|
AURC_%Extrap(_obs, _pred) |
Percent of AURC_INF(_obs, _pred) that is extrapolated. |

Sparse sampling (pre-clinical) data
When an NCA model is loaded with the Sparse Sampling option (see “Options tab”), the data are treated as a special case of plasma or urine concentration data. The NCA engine computes the mean concentration or rate at each unique time value or interval. Using the mean concentration curve across subjects, it estimates the same parameters normally calculated for plasma or urine data, plus those listed below. See “Sparse sampling calculation” for additional details of NCA computations with sparse data.
Note:The names of some of the output worksheets change when the data is sparse: Final Parameters becomes Mean Curve Final Parameters, and Summary Table becomes Mean Curve Summary Table.
Plasma or serum concentration parameters
Sparse sampling methods for plasma data (models 200–202) compute the following parameters in addition to those listed in “Plasma or serum data”.
|
Parameter |
Description |
|
SE_Cmax |
Standard error of data at Tmax (time of maximum mean concentration). |
|
SE_AUClast |
It is the standard error of the area under the mean concentration curve from dose time to Tlast, where Tlast is the time of last measurable (positive) mean concentration. |
|
SE_AUCall |
Standard error of the area under the mean concentration curve from dose time to the final observation time. |
Note:SE_AUClast and SE_AUCall provide a measurement of the uncertainty for AUClast and AUCall, respectively, and are usually the same. Differences between these parameter values will only be observed if some of the measurements were flagged as BQL (below the quantitation limit).
Urine excretion rate parameters
Sparse sampling methods for urine data (models 210–212) compute the following parameters in addition to those listed under “Urine data”.
|
Parameter |
Description |
|
SE_Max_Rate |
Standard error of the data at the time of maximum mean rate. |
|
SE_AURC_last |
Standard error of the area under the mean urinary excretion rate curve from dose time through the last interval that has a measurable (positive) mean rate. |
|
SE_AURC_all |
Standard error of the area under the mean urinary excretion rate curve from dose time through the final interval. |
Individuals by time
This sheet includes the individual subject data, along with N (number of non-missing observations), the mean and standard error for each unique time value (plasma data) or unique midpoint value (urine data).
References
Holder (2001). Comments on Nedelman and Jia's extension of Satterthwaite's approximation applied to pharmacokinetics. J Biopharm Stat 11(1-2):75–9.
Nedelman, Gibiansky and Lau (1995). Applying Bailer's method for AUC intervals to sparse sampling. Pharm Res 12:124–8.
Nedelman and Jia (1998). An extension of Satterthwaite's approximation applied to pharmacokinetics. J Biopharm Stat 8(2):317–28.
Yeh (1990). Estimation and Significant Tests of Area Under the Curve Derived from Incomplete Blood Sampling. ASA Proceedings of the Biopharmaceutical Section 74–81.
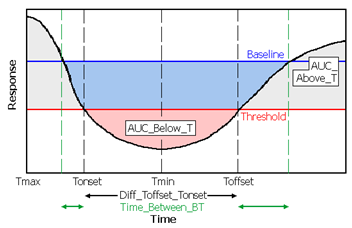
Illustration of a time-effect curve with AUCs highlighted
Output parameter names use the following conventions:
•B is the baseline effect value (discussed above).
•T is the user-supplied threshold effect value.
•“Above” means towards increasing Y values, even for inhibitory effects.
|
Parameter |
Description |
|
N_Samples |
This parameter reports the number of non-missing observations used in the analysis of the profile (time is at or after dosing time, the observation is numeric, and the volume is positive for urine models). |
|
Slope1 (or 2) |
Slope of the first (or second) segment of the curve. |
|
Rsq_Slope1 (or 2) |
Goodness of fit statistic for slope 1 or 2. |
|
Rsq_adj_Slope1 (or 2) |
Goodness of fit statistic for slope 1 or 2, adjusted for the number of points used in the estimation. |
|
Corr_XY_Slope1 (or 2) |
Correlation between time (X) and effect (or log effect, for log regression) (Y) for the points used in the slope estimation. |
|
No_points_Slope1 (or 2) |
The number of data points included in calculation of slope 1 or 2. |
|
Slope1_lower or |
Lower limit on Time for values to be included in the slope calculation. |
|
Slope1_upper or |
Upper limit on Time for values to be included in the slope calculation. |
|
Tmin |
Time of minimum observed response value (Rmin). |
|
Rmin |
Minimum observed response value. |
|
Tmax |
Time of maximum observed response value (Rmax). |
|
Rmax |
Maximum observed response value. |
|
Baseline |
Baseline response (Y) value supplied by the user, (assumed to be zero if none is supplied) or, for Certara Integral studies with no user-supplied baseline value, effect value at dose time. |
|
AUC_Above_B |
Area under the response curve that is above the baseline (dark gray areas in the above diagram). |
|
AUC_Below_B |
Area that is below the baseline and above the response curve (combined blue and pink areas in the above diagram). |
|
AUC_Net_B |
= AUC_Above_B – AUC_Below_B |
|
Time_Above_B |
Total time that Response >= Baseline. |
|
Time_Below_B |
Total time that Response < Baseline. |
|
Time_%Below_B |
= 100*Time_Below_B/(Tfinal – Tdose) |
When a threshold value is provided, model 220 also computes the following.
|
Parameter |
Description |
|
Threshold |
Threshold value used. |
|
AUC_Above_T |
Area under the response curve that is above the threshold value (combined light and dark gray areas in the above diagram). |
|
AUC_Below_T |
Area that is below the threshold and above the response curve (pink area in the above diagram). |
|
AUC_Net_T |
= AUC_Above_T – AUC_Below_T |
|
Time_Above_T |
Total time that Response >= Threshold. |
|
Time_Below_T |
Total time that Response < Threshold. |
|
Time_%Below_T |
= 100*Time_Below_T/(Tlast – Tdose) |
|
Tonset |
Time that the response first crosses the threshold coming from the direction of the baseline value, as shown in the above diagram. Tonset=Tdose if the first response value is across the threshold, relative to baseline. |
|
Toffset |
Time greater than Tonset at which the curve first crosses back to the baseline side of threshold, as shown in the diagram above.a |
|
Diff_Toffset_Tonset |
= Toffset – Tonset |
|
Time_Between_BT |
Total time spent between baseline and threshold (sum of length of green arrows in diagram). |
|
AUClower_upper |
(Optional) user-requested area(s) under the curve from time “lower” to time “upper”. |
|
aUse caution in interpreting Tonset and Toffset for noisy data if Baseline and Threshold are close together. |
Any user defined parameters will be computed and reported in the User Defined Parameters and User Defined Parameters Pivoted worksheets. The worksheets include entries for Sort, Carry, parameter name, unit, and estimated value. A User Defined Parameters Pivoted worksheet will include the pivoted form of the User Defined Parameters worksheet.
|
Parameter |
Description |
|
C<time value> |
For Plasma models with user-defined times only, one column per requested time value. |
|
Y<x-value> |
For Drug Effect models with user-defined x-values only, one column per requested x-value. |
|
<user-defined name> |
Parameter defined using the User Defined Parameters tab. |
Holder (2001). “Comments on Nedelman and Jia's extension of Satterthwaite's approximation applied to pharmacokinetics.” J Biopharm Stat 11(1–2):75–9.
Nedelman and Jia (1998). “An extension of Satterthwaite's approximation applied to pharmacokinetics.” J Biopharm Stat 8(2):317–28.
