The Reporter object generates and maintains clinical and pre-clinical study reports based on data and analyses resulting from the execution of Phoenix Workflow objects. It is designed to work with tables, graphs, text objects, and worksheets. For example, the Reporter object can take output from the AutoPilot Toolkit, PK tables and graphs and place them into final or interim reports.
Use one of the following to add the object to a Workflow:
Right-click menu for a Workflow object: New > Reporting > Reporter.
Main menu: Insert > Reporting > Reporter.
Right-click menu for a worksheet: Send To > Reporting > Reporter.
Note:To view the object in its own window, select it in the Object Browser and double-click it or press ENTER. All instructions for setting up and execution are the same whether the object is viewed in its own window or in Phoenix view.
Additional information is available on the following topics:
Define the report content
Table options
Figure options
Pagination in the report
Captions
Footnotes
Report document setup
Handling lost connections
Object output
Setting up preferences
In the Setup tab, check item(s) in the hierarchical list to include them in the report. Selecting the top level node selects all child content below the node.
Uncheck item(s) in the hierarchical list to exclude them from the report. You can also click the red X next to the item in the lower list to delete it (the item is automatically unchecked in the top list).
Reporter is designed to recognize certain objects in a project as tables, figures, or lists and will add the appropriate form of content to the lower list.
![]() Table: Added to the content list when any of the following are selected:
Table: Added to the content list when any of the following are selected:
HTML (results of a Table object or from Tables folder of project)
Worksheets (from Data folder or results of object)
AutoPilot Toolkit spreadsheets
Comparer Plot table (from NONMEM Comparer or Maximum Likelihood Model Comparer)
![]() Figure: Added to the content list when any of the following are selected:
Figure: Added to the content list when any of the following are selected:
Plots (from results of Plot objects or from plot results of objects)
AutoPilot Toolkit image (WMF, EMF, JPG)
Documents folder images (WMF, EMF, BMP, PNG, JPG)
Figures can be displayed in a grid or lattice, see “Report document setup” for instructions.
![]() Listing: Added to the content list when any of the following are selected:
Listing: Added to the content list when any of the following are selected:
Text file (results of an object)
Code folder items
The lower list displays the selected content using the following naming convention:
ProjectName.Workflow.Object.Source.Name. The items in this list can be reordered by dragging and dropping. Selecting an item in the list displays a preview in the panel on the right. (Note that any links displayed in the preview area, such as in the list of tables or figures, will not function until the document is exported.)
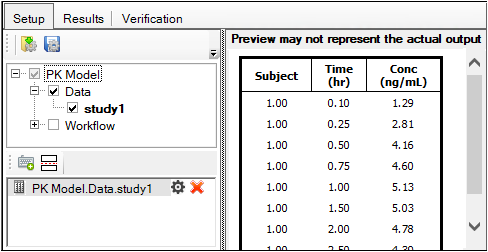
Setup tab showing preview of a mapped table
Click ![]() (Free Form icon) in the toolbar of the lower list for direct entry of text to include in the report.
(Free Form icon) in the toolbar of the lower list for direct entry of text to include in the report.
Any formatting, such as bold, italic, underline, superscript, subscript, use of symbols is preserved in the Reporter object’s output document.
Items will appear in the output in the order they are shown in the lower list. To change the order, do either of the following:
Click an item and drag it to the new position in the list.
Ctrl or Shift+click to select multiple items and drag them to the new position.
Note that the order of the multi-selected items is maintained in the new location.
In the Options tab, specify the type of table to generate in the output:
Word table (Create Word tables): This is the default type. These tables can be modified using the tools in Word.
Image (Create Images): To prevent table contents from being modified, select this option and tables will be inserted as images in the output document.
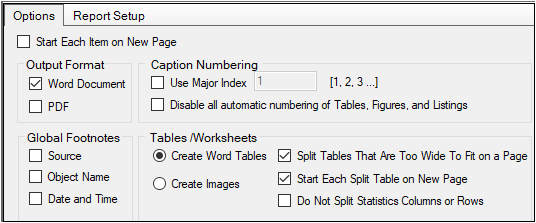
There are some tables generated by Phoenix and its modules that are too wide to fit on a single page of a report. Several options are available in the Options tab for setting how and when to allow splitting of such tables.
Split tables that are too wide to fit on a page controls splitting of tables. When unchecked, there is no table splitting, regardless of the table size.
The Start each split table on new page option becomes available when the Split tables… option is checked and, when selected, forces each split table to begin on a new page.
The Do not split statistics columns or rows option becomes available when the Split tables… option is checked and, when selected, prevents table splitting from occurring between statistics columns and/or rows.
-
Click
 (Options icon) next to the figure’s name in the lower list.
 -
Click the Figure tab in the dialog.
-
Check the Set Y-axis scale in report box.
-
Select Linear to output the figure with a linear scale.
-
Select Logarithmic to output the figure with a log scale. Use the menu to select the type of logarithmic scale to use.
-
Select Linear and Logarithmic to output the figure twice, with linear scale and log scale, stacking the figures vertically. Use the menu to select the type of logarithmic scale to use.
If the Arrange figures in a lattice option is selected, then each log plot will be immediately after the corresponding linear plot, following the specified number of Columns per row.
A lattice provides the opportunity to organize the display of multiple graphs in a grid layout.
-
Click the Reporter Options icon next to a figure item in the lower list.
-
Click the Figure tab in the dialog.
-
Check the Arrange figures in a lattice box.
-
Specify the number of columns in the lattice using the Columns per row option.
-
Specify the number of rows in the lattice using the Rows per page option. (Select To fit to have as many rows in the lattice as will fit on the page.)
-
To display borders for the rows and columns in the report, check the Show grid lines box.
-
If the Show figure numbers in lattice cells box is unchecked, the individual figures in the lattice cells will not be numbered in the report (but the figure number will still be above the lattice).
Indicating new pages in the report generated by the Reporter object can be accomplished in several ways.
-
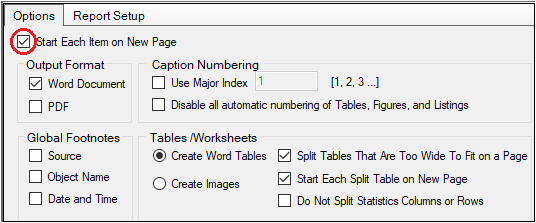
To place each Reporter item on a separate page, check the Start each Item on New Page checkbox in the Options tab.
-
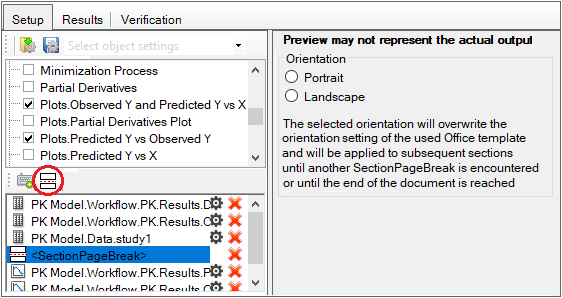
To insert a page break in between two particular Reporter items, click
 in the lower list toolbar item. A Section Page Break is placed after the selected item in the lower list. (To specify the orientation of the page(s) in the section, select the Section Page Break item in the list and click Portrait or Landscape in the panel to the right of the list.)
-
To avoid tables starting on a page with the previous item and then continuing on the next page, turn on the Start each Split Table on New Page checkbox in the Options tab.
All tables, figures, and listings are automatically numbered sequentially (e.g.,Table 1:, Table 2:, etc.). The same is true for figures and listings.
-
To turn off the automatic numbering, check the Disable all automatic numbering of Tables, Figures, and Listings box.
-
To use a specific primary number (e.g., Table 1.1, Table 1.2, etc.), in the Options tab, with the Use Major Index checkbox checked, enter the desired primary number in the field. Up to four numbers and three periods can be entered in the field, which would generate level five headings.
Latticed figures are automatically numbered sequentially within the lattice cells, using the figure number as the primary number (e.g., Figure 3.1, Figure 3.2, etc.), but this can be turned off by unchecking the Show figure numbers in lattice cells checkbox.
(Click the Reporter Options icon next to a figure item and select the Figure tab).
A caption can be defined for a table, figure, or listing item. Once defined, the caption can be saved, which adds it to the Caption tab’s dropdown menu. Select the caption from the dropdown and reuse it within the same project or even across projects. See “Save and reuse captions” for more information.
-
To create a caption, click the Reporter Options icon next to the item in the lower list.
-
In the Caption tab, enter the text in the Caption Text field, or paste content from the Windows clipboard.
The text can be emboldened, italicized and superscripted/subscripted by selecting the text and clicking on the desired font style. To add a symbol, select it from the Insert Symbols pull-down.
If the entry mapped to the Reporter object is based on a worksheet, the Source – Data Worksheet / Object Source option will be active on the Caption tab, allowing data from the worksheet itself to be placed into the caption. The column names (and column units, if applicable) from the relevant worksheets are displayed on the right.
In the following figure, the text Table results for Subject has been typed into the Caption Text field and then the entry Subject has been added by dragging it from the list on the right.

Caption tab with text entered
After execution of the Reporter object, the caption, as defined in the Caption tab, appears in the output above the associated table, figure, lattice, or list.
Optional text can be included in a caption. This text will appear in the caption in the generated tables or figures if at least one of the specified column(s) are present. When entering the caption in the Caption Text field, use double angle brackets before (<<) and after (>>) the text that is optional. For example:
PK Parameter table for subjects #1:Subject# <<having matrices #2:Matrix#>>
When the Report object is executed, the appropriate worksheet will be checked to see if it includes a Matrix column. If the column is present, the portion of the caption within the double angle brackets will be included. If the worksheet does not contain a Matrix column, then the optional text will not be included.
Commonly used captions can be saved and reused.
To add a new caption to the saved list
-
Enter the caption text and adjust formatting as desired.
-
If the Caption Text pull-down is blank, click on either
 (Save) or
  (Save As). A Save As dialog is displayed that lists any saved captions. Click Save to add the new caption to the saved list.
 -
If the Caption Text pull-down is not blank, click the Save As icon to display the Save As dialog and then click Save.
Captions are saved to the settings file specified in the Preferences dialog.
To edit a saved caption
-
Select the saved caption from the Caption Text pull-down.
-
Modify the text as desired and formatting as desired.
-
Click the Save icon (this overwrites the saved caption).
Or
Click the Save As icon and select the saved caption to overwrite, then click Save.
The saved captions are accessible from the Caption tab for any item selected in the Setup panel.
Upon retrieval of the caption, the validity of the column pattern is checked. If the column name no longer exists, double angle brackets (<< >>) are inserted to surround the column pattern in the caption. If << >> already exists, the column name is not checked until the Reporter object is executed.
Deleting a saved caption must be done manually by editing the setting file.
Footnotes can be defined as global or individual item footnotes. In addition, a contextual footnote may be created, see “Manage contextual footnotes” for more information.
A global footnote adds source information, object name, and/or a date-time stamp as a footnote to every individual table, figure, listing, and group member (time-concentration graphs only). This is accomplished by checking the Global Footnotes checkbox(es) on the Options tab.
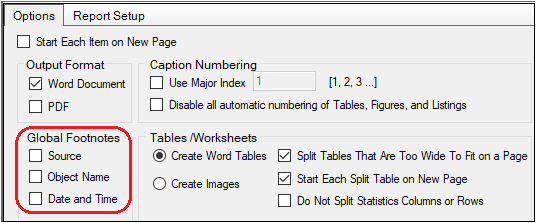
For a Worksheet, Table, Figure, or Listing result in the report, selecting the Date and Time global footnote option adds the date and time of execution for the object that generated that result. For items in the report that are not the result of an execution (e.g., data in the Data folder), the date and time of the last save of the project is used.
An individual item footnote can be defined for a table, figure, or listing. Once defined, the footnote can be saved, which adds it to the Footer tab’s dropdown menu. Select the footnote from the pull-down and reuse it within the same project or even across projects. See “Save and reuse footnotes” for more information.
-
To create a footnote, click the Reporter Options icon next to the item in the lower list.
-
In the Footer tab, enter the text in the Footnote Text field, or paste content from the Windows clipboard.
The text can be emboldened, italicized and superscripted/subscripted by selecting the text and clicking on the desired font style. To add a symbol, select it from the Insert Symbols pull-down.
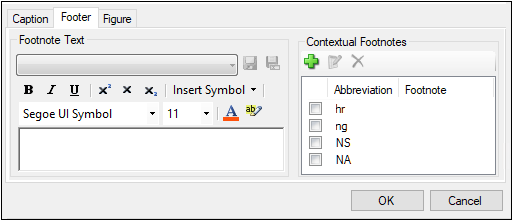
After execution of the Reporter object, the footnote, as defined in the Footer tab, appears in the output below the associated table or figure.
Commonly used footnotes can be saved and reused.
To add a new footnote to the saved list
-
Enter the footnote text and adjust formatting as desired.
-
If the Footnote Text pull-down is blank, click on either the Save icon or the Save As icon. A Save As dialog is displayed that lists any saved footnotes. Click Save to add the new footnote to the saved list.
-
If the Footnote Text pull-down is not blank, click the Save As icon to display the Save As dialog and then click Save.
Footnotes are saved to the settings file specified in the Preferences dialog and will be added to the list in the Footnote panel pull-down.
To edit a saved footnote
-
Select the saved footnote from the Footnote Text pull-down.
-
Modify the text as desired and formatting as desired.
-
Click the Save icon (this overwrites the saved footnote).
Or
Click the Save As icon and select the saved footnote to overwrite, then click Save.
The saved footnotes are accessible from the Footnote tab for any item selected in the Setup panel.
Deleting a saved individual item footnote must be done manually by editing the actual settings file.
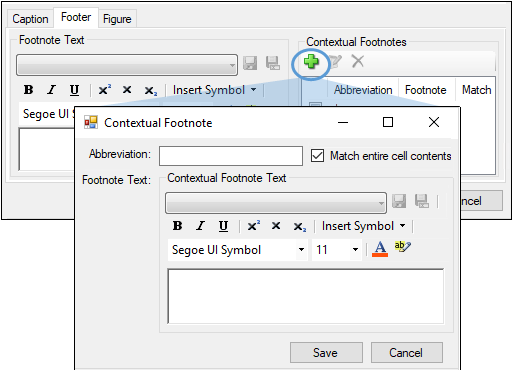
Contextual footnotes may be added to Table items to clarify abbreviations that appear as cell values in the table. The footnote will be added only if the specified abbreviation is found within the generated table.
To add a contextual footnote
-
Click
 (Add Footnote icon).
 -
In the Contextual Footnote dialog, enter the text to search for in the Abbreviation field.
-
Use the Match entire cell contents checkbox to toggle between performing an exact match or partial match search for the abbreviation.
-
In the Footnote Text field, type the text to display as a footnote below the table if the abbreviation is found.
-
Click Save to add the contextual footnote information to the Footnote panel.
-
Use the checkboxes in the Contextual Footnote list to indicate the abbreviations to search for within the selected Table item.
When the Reporter object is executed, the tables will be checked for the presence of the identified abbreviations. If present, the footnote text will be added below the table. If the abbreviation is not present, the footnote will not be added.
To edit a contextual footnote
-
In the Contextual Footnotes list, select the footnote to edit.
-
Click
 (Edit Footnote icon).
 -
Make the desired changes in the Contextual Footnotes dialog and click Save.
To delete a contextual footnote
-
In the Contextual Footnotes list, select the footnote to delete.
-
Click X.
