Reporter generates Word and PDF files as output.
To specify which format to generate, in the Options tab, check the boxes for the desired format: Word Document, PDF, or both.
To select a predefined Word template file (.dotx or .dotm) to apply when generating the report:
-
Select the Report Setup tab.
-
Enter the path to the template file or click Browse to navigate and select the file from file system or click Project Documents to select the template from the Documents folder for an open project.
Note:Page settings are not available if a template is specified.
To define size, margins, and orientation of the report pages:
-
Select the Report Setup tab.
-
Select a size from the Page Size dropdown menu.
-
Enter or use the arrows to set each of the margins for the report pages.
-
Click the desired orientation of the pages (Portrait or Landscape). This can be changed with Section Page Break.
Include captions in document contents lists
The table and figure captions can be added to either the Table of Contents or in separate lists of tables and/or figures.
-
Select the Report Setup tab.
-
Check the Table and Figure Captions Listings box to include captions in the report.
-
Click the desired radio button to indicate where to add the captions.
-
If the option to Include Table and Figure Captions in Separate List(s) is selected, use the checkboxes to select the lists to create: Include List of Tables, Include List of Figures, or both.
Connection between an input source and the Reporter object can occasionally be lost.
-
The result that is mapped as the input source is no longer available.
For example, a Reporter object has an AutoPilot Toolkit table as its input source. The AutoPilot Toolkit settings are then modified to not include that particular table in the output and the AutoPilot Toolkit object is re-executed. -
The object generating the input source is no longer available.
For example, a Reporter object has an AutoPilot Toolkit table as its input source. The AutoPilot Toolkit object is then removed from the Workflow. -
The connector to the input is deleted in the Workflow Diagram.
When a lost connection occurs, an icon will appear next to the associated Input item in the Reporter object.

Setup tab showing a lost connection of a Reporter item
To re-establish the connection, recheck the Input Object or remove it and then add a new Input Object.
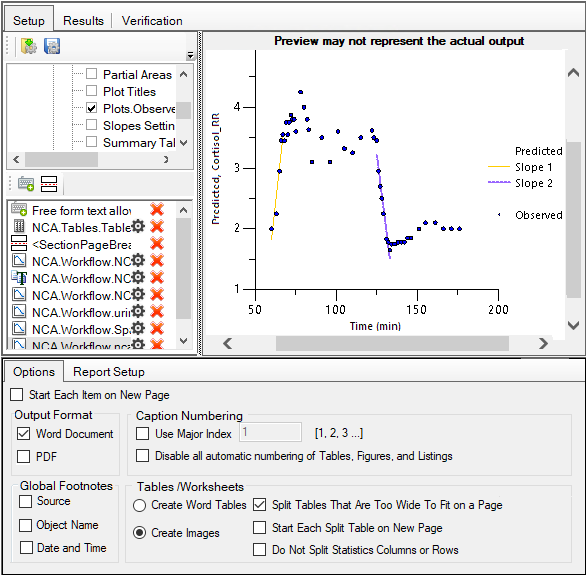
The Reporter object shown in the following image was executed to produce the example output for this section.

Reporter object setup used to generate example output
To open the Reporter output document
-
Click the Results tab.
-
Click Report under Results.
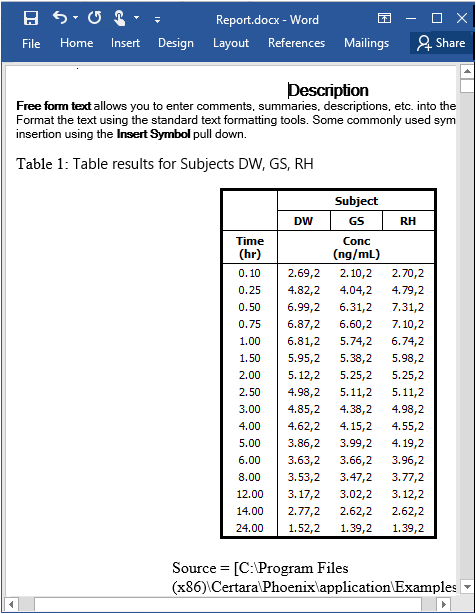
The following are pictures of the Word document containing the Reporter output.
The Description is an example of the Free Form Text item. This is followed by a results table from a Table object. The table has a caption and a footnote shows the table’s source.

Example output showing free form text and tables with captions and/or footnotes
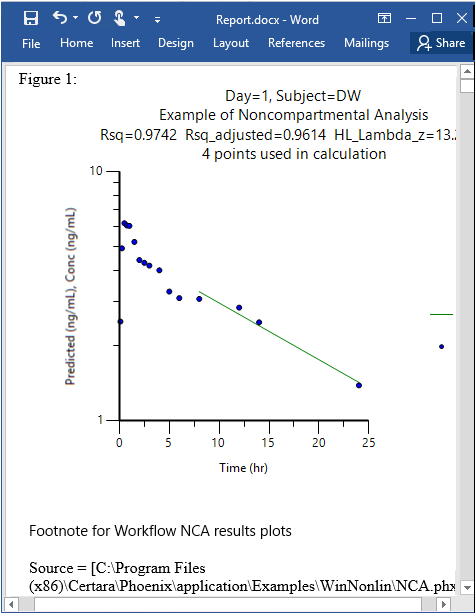
The next image shows one of the NCA results plot for which a footnote has been defined.

Example output showing a graph, caption, and footnotes
Several pages follow, each with an additional NCA results plot. Then several pages of text show the contents of the Core Output file for the NCA analysis.
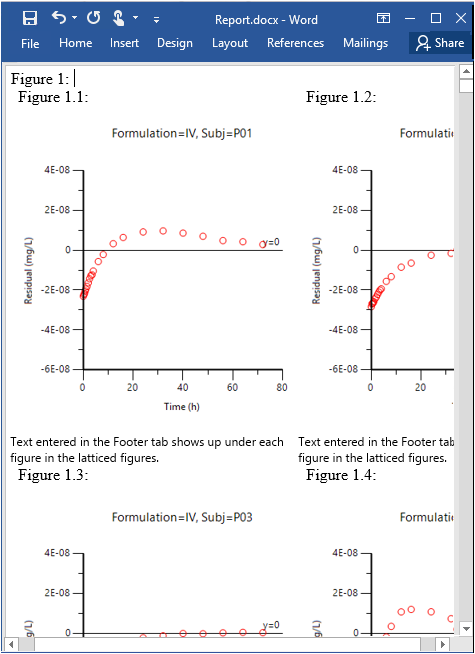
The following image shows a two-column lattice of graphs. The latticed figure has it’s own number and each cell within the lattice is numbered as well. Note that the footnote that was added appears below each latticed figure.

Example output showing a lattice of graphs and footnote
By default, saved captions and footnotes are added to the file. The Reporter panel of the Preferences dialog is where the XML file to use for populating the Caption and Footnote panels’ pulldown menus is specified. This file also contains contextual footnote information. The default file is: C:\Users\<user>\AppData\Roaming\Certara\Phoenix\Configuration\Reporter\SavedResources.xml.
-
Select Edit > Preferences.
-
In the Preferences dialog, select the Reporter item in the menu tree.

Captions and footnotes can be shared between users. This can be done by users loading an XML file with a set of pre-defined captions and footnotes (click […]) or by merging captions and footnotes from a different file into the one currently in use (Import into Current).
To save the contents of the currently selected XML file to a file with a different name, click Save As and specify the new file’s name and location.
