Discontinuous observed variable tab(s) options
Many of the options available for a discontinuous variable are the same as those for the continuous variable, Descriptions for those common options can be found in the “Continuous observed variable tab(s) options” section.
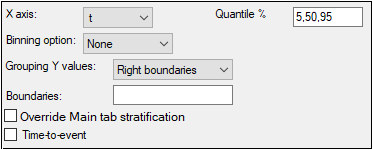
Note that the Xaxis and Binning option are available for categorical and count observations (i.e., it is available only when the Time-to-event checkbox is unchecked).

-
Use the Grouping Y values menu to specify whether Y (dependent variable) values are to be grouped (Right boundaries) or not (None) to calculate the summary statistics. This option is available for categorical and count observations (i.e., it is available only when the Time-to-event checkbox is unchecked).
If Right boundaries is selected, specify a list of Y values (separated by comma) to define the right boundaries of grouping intervals in the Boundaries field. For example, if one enters 1 in the Boundaries field, as shown in the image above, then the system will calculate the observed and simulated fraction observations for Y=0 and Y >=1. -
The Time-to-event checkbox becomes available in cases of event, count, LL, or multi-statement. When checked, the Times field shows the same syntax as in the simulation tab and an additional worksheet is generated (Predcheck_TTE). The user should use this option when Kaplan-Meyer plots are required for a particular variable.
Note that, in the case of time-to-event simulations, only the first event is used, subsequent events are ignored.
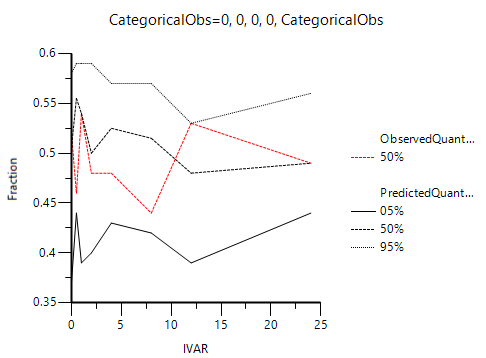
The image below shows the plot of observed fraction (depicted by the red line) and the 5%, 50%, and 95% quantiles (the default values entered in the Quantile % field) of simulated fraction (depicted by the black lines) for a categorical observed variable (CategoricalObs) having a value 0 (i.e., CategoricalObs = 0) versus the chosen X-axis.

