Phoenix can compute summary statistics for variables in any worksheet. This feature is frequently used to create data to plot means and standard errors, for preclinical summaries, to summarize modeling results, or to test for normal distribution of data. Separate statistics for subgroups are obtained through the use of one or more sort variables.
Use one of the following to add the object to a Workflow:
Right-click menu for a Workflow object: New > Computation Tools > Descriptive Statistics.
Or Main menu: Insert > Computation Tools > Descriptive Statistics.
Or right-click menu for a worksheet: Send To > Computation Tools > Descriptive Statistics.
Note:To view the object in its own window, select it in the Object Browser and double-click it or press ENTER. All instructions for setting up and execution are the same whether the object is viewed in its own window or in Phoenix view.
This section includes information on the following:
User interface description
Statistical results and computational formulas
Weighted summary statistics
Main Mappings panel
Options tab
Use the Main Mappings panel to identify which variables are used to compute statistics or weight the data. Required input is highlighted orange in the interface.
None: Data types mapped to this context are not included in any computation or output.
Summary: The variable(s) for which statistics are computed.
Sort: Categorical variable(s) identifying individual data profiles, such as subject ID or gender. Separate statistics are computed for each unique combination of sort variables.
Weight: If a weight variable is present in the dataset, it can be used to weight the summary statistics. If a weight is non-numeric or missing, the observation is excluded from the analysis. If a weight is negative, it is changed to zero (0) upon execution.
See “Statistical results and computational formulas” for a full list of the available statistics.

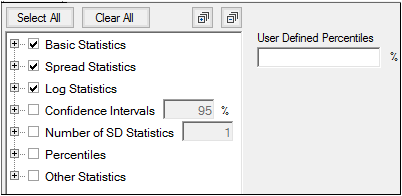
Use the tree on the right to select the statistics to compute and include in the report by checking the corresponding checkboxes.
The available statistics are grouped into categories and checking/unchecking a category checkbox controls all of the checkboxes for statistics within that category. For example, unchecking the Spread Statistics checkbox unchecks the Min, Median, Max, and Range checkboxes.
Click the Select All or Clear All buttons to quickly check/uncheck all checkboxes in the list, respectively, with a single click.
Click the ![]() button to expand all categories in the tree. Click the
button to expand all categories in the tree. Click the  button to collapse all categories in the tree.
There are a number of preset percentiles available in the Percentiles category (1, 2.5, 5, 10, 25, 50, 75, 90, 95, 97.5, 99). However, if you wish to include other percentiles, enter them as a comma-separated list in the User-specified percentiles field.
To generate confidence interval statistics, type the desired confidence interval in the Confidence Interval field.
Check the Confidence Intervals checkbox to compute all statistics in that category or expand the category to select a subset of the statistics
To generate standard deviation statistics, type the desired number of standard deviations in the Number of SD Statistics field. The value must be greater than 0 and less than or equal to 10.
Check the Number of SD Statistics checkbox to compute all statistics in that category or expand the category to select a subset of the statistics.
