A Workflow Template in Phoenix works like a template in Microsoft Word, it allows users to recreate the same steps over and over, and gives users a form or fields that can be used to automatically recreate a workflow to use with a new dataset.
Workflow Templates are files that contain the operational objects and settings used with a workflow. Workflow Templates are saved as .phxtmplt files. (Note that older WinNonlin Template (*.wnlt) files can still be loaded into Phoenix, but are no longer created by Phoenix.)
Workflow Templates can be created to expedite future analysis for workflows that are created to perform complex or specific functions. Templates contain the specific configuration of each operational object in a workflow, but do not contain the original data input sources.
Note:Workflow Template files do not contain any mappings or links to external data sources, which means templates do not have data mappings to external sources, or with any parameter settings in external scripts (e.g., used when connecting with third-party tools).
What does a Workflow Template do?
Workflow templates save a workflow operational object, and all the operational objects it contains. They also save pointers to results data, such as a Final Parameters worksheet.
How are Workflow Templates different from workflows?
Workflow Templates do not store pointers to non-results data, such as imported worksheets.
Workflows and objects contain pointers to datasets, but templates do not.
How are Workflow Templates different from project files?
Project files save all parts of the project: all the datasets, code, rule sets, other information objects, and all workflows and operational objects.
Workflow Templates save the setup information for workflow and operational objects, and any pointers to an operational object’s results data.
What are the benefits of a Workflow Template?
A workflow can be saved as a Workflow Template, in order to reapply an analysis on new data. This allows a common analysis to be predefined for automated performance of repetitive analyses.
Workflow Templates can be imported into a workflow, although Workflow Templates do not save any datasets or data mappings.
Note:When a Workflow Template is imported into a workflow, it is necessary to remap any external data sources to objects in the Workflow Template.
Tip: Default templates can be shared with others by having an administrator set up the template preferences file default_templates.binconfig, located in C:\Users\<username>\AppData\Roaming\Certara\Phoenix\Configuration to point to a common location where the shared templates will be stored. Notifications can then be sent by the administrator with the configuration file, template files, and instructions on where to store the files.
This section contains the following topics:
•“Saving and loading Workflow Templates”
•“Workflows and Templates example”
Saving and loading Workflow Templates
In situations where a particular workflow is commonly used, saving it as a Workflow Template allows you to simply load the template file rather than recreate the entire workflow every time. The objects, their connections, and settings are saved in a Workflow Template file (the file extension is .phxtmplt).
Once a workflow is created that you would like to save as a template, it can be saved to a Workflow Template file. The default location for saved Workflow Templates is set through the Project Settings page of the Preferences dialog (Edit > Preferences, select General > Projects).
To save a workflow template
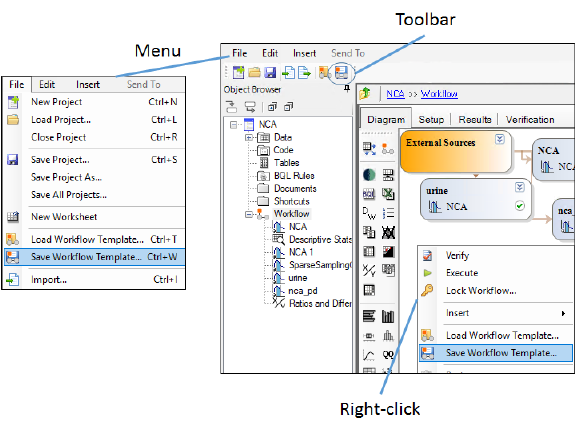
Select the Workflow object in the Object Browser or in the Diagram.
In the main Phoenix toolbar, click ![]() .
.
Or select File > Save Workflow Template in the Phoenix menubar.
Or right-click the Workflow object or empty area in the Object Browser and select Save Workflow Template.
Or right-click an empty area in the Diagram and select Save Workflow Template.
In the Save Workflow Templates dialog, enter a name for the template file.
If you want to save the workflow’s history with the template file, uncheck the Clear History checkbox.
Click Save.
To add a workflow template to the current workflow
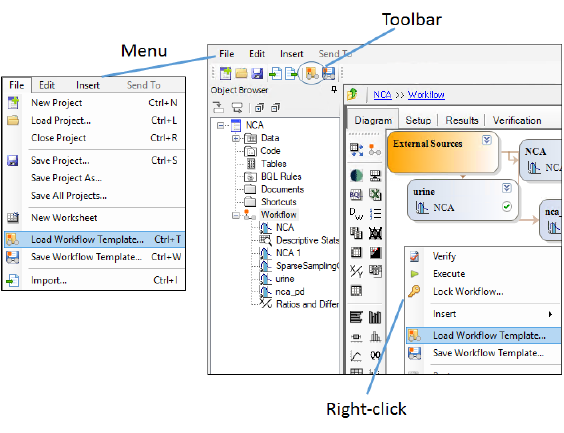
Select a project or any Workflow object in the Object Browser or in the Diagram:
In the main Phoenix toolbar, click ![]() .
.
Or select File > Load Workflow Template in the Phoenix menubar.
Or right-click the Workflow object or empty area in the Object Browser and select Load Workflow Template.
Or right-click an empty area in the Diagram and select Load Workflow Template.
In the Load Workflow Templates dialog, select the template.
If desired, enter a suffix to append to the names of the imported objects.
Click Open.
Note:Workflow templates do not load internal worksheets with sort variables, since sorts usually indicate profile-specific data. Use external worksheet or Data Links (see “Data Links Object”) to optimize re-use of templates.
Workflows and Templates example
The purpose of the example is to show Phoenix’s ability to create and reuse workflows. This example shows users how to create a workflow to perform an analysis, save the workflow as a template, and use the template to complete the same analysis using different data.
This example assumes that a drug company wants to create a generic form of a popular drug. The company wants to test two formulations of a compound in order to decide which formulation is closest in bioequivalence to the name brand drug. In this example users will create a workflow to test the first formulation, save the workflow as a template, and reuse the template to test the second formulation.
Data for this study were created using Certara’s Trial Simulator™.
Note:The completed project (Templates.phxproj) is available for reference in …\Examples\Data and Plots.
Most Phoenix objects require the same basic steps for their use. However, there may be multiple paths to accomplishing a step (e.g., main menu, right-click menu, drag-and-drop, etc.). For simplicity, only one is listed here.
Note:Any object added to a project can be viewed in its own window by selecting the object in the Object Browser and double-clicking it or pressing ENTER. All instructions for setting up and executing an object are the same whether the object is viewed in its own window or in Phoenix’s viewing.
Set up the workflow
A Workflow object is the part of the project that is used to contain and manage operational objects, similar to how the Data folder is used to contain and manage datasets.
Workflows can be set up to perform complex operational procedures using operational objects. A Workflow can be saved as a template file, which allows users to create complex operational procedures once, and reuse and share them multiple times.
The advantage of a template is that it saves the configuration settings in each of the operational objects it contains. However, templates do not save mappings to external datasets. This means that a template can be created that can be easily reused with multiple datasets.
-
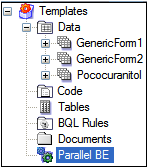
Create a new project called Template.
-
Import the following datasets from …\Examples\WinNonlin\Supporting files\.
GenericForm1.xls
GenericForm2,xls
Pococuranitol.xls -
Select the Has units row option for both the GenericForm1_data and GenericForm1_dose worksheets.
-
Click the
 button to continue advancing through the other preview screens, select the Has units row option for each worksheet except the History worksheet, as before.
 -
Click Finish.
-
Rename the workflow as Parallel BE.
-
Right-click Parallel BE in the Object Browser and select New > Data > BQL.
-
Rename the BQL object as BQL Brand.
-
Insert a second BQL object into the workflow named BQL Generic.
Note:Datasets in XLS (Microsoft Excel Workbook) format are added to the Data folder as workbooks.
BQL is an acronym for Below Quantifiable Limit. BQL rules are used to exclude values in a dataset that are too low to be useful in an analysis.
Create and map the BQL rule set
BQL rule sets are created and stored in the BQL Rules folder.
-
In the Object Browser, right-click the BQL Rules folder and select New > Rule Set.
-
Type ERR under Nonnumeric Code.
-
Type 0 (zero) under Unconditional Substitution.
-
Check the Use When < LLOQ checkbox.
-
In the Properties tab below the Setup panel, check the Use Static LLOQ Value checkbox.
-
Type 0.01 in the LLOQ Value field.
-
Select the Parallel BE workflow in the Object Browser.
-
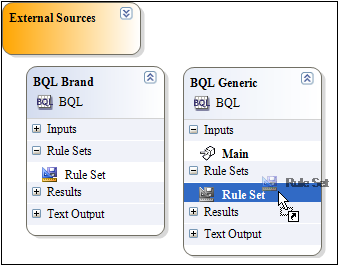
In the Diagram, click the chevron
 buttons to expand BQL Brand and BQL Generic.
 -
Click the (+) symbols to expand Rule Sets for both BQL objects.
-
Drag the Rule Set from the BQL Rules folder to the BQL Rule Set input for both BQL Brand and BQL Generic.
Setup BQL objects
-
In the Object Browser, select BQL Brand in the Parallel BE workflow.
-
Expand the Pococuranitol workbook in the Data folder and drag the Pococuranitol_data worksheet to BQL Brand’s Main Mappings panel.
-
Map the data types to the following contexts:
Subject to the Sort context.
Time to the Time context.
Concentration to the Concentration context.
Leave all other data types mapped to None. -
In the Output Column Name field in the Properties tab below the Setup panel, type BrandConc_gt_0_01.
-
Click
 to execute the object.
 -
Select BQL Generic in the Parallel BE workflow.
-
Expand the GenericForm1 workbook in the Data folder and drag the GenericForm1_data worksheet from the Data folder to the Main Mappings panel.
-
Map the data types as follows:
Subject to the Sort context.
Time to the Time context.
Concentration to the Concentration context.
Leave all other data types mapped to None. -
In the Output Column Name field type GenericConc_gt_0_01.
-
Click
 to execute the object.
Set up two Descriptive Stats objects
-
Go to the Results tab of the BQL Brand object.
-
Right-click the Output worksheet and select Send To > NCA and Toolbox > Descriptive Stats.
-
Rename the Descriptive Stats object Descriptive Stats Brand.
-
Map the data types as follows:
Subject mapped to None.
Time to the Sort context.
BrandConc_gt_0_01 to the Summary context. -
In the Options tab, check the Confidence Intervals and Number of SD Statistics checkboxes, but do not change the default values for these two items.
-
Click
 to execute the object.
 -
Go to the Results tab of the BQL Generic object.
-
Right-click the Output worksheet and select Send To > NCA and Toolbox > Descriptive Stats.
-
Rename the Descriptive Stats object Descriptive Stats Generic.
-
Map the data types as follows:
Subject mapped to None.
Time to the Sort context.
GenericConc_gt_0_01 to the Summary context. -
In the Options tab, check the Confidence Intervals and Number of SD Statistics checkboxes, but do not change the default values for these two items.
-
Click
 to execute the object.
A Descriptive Stats object is inserted into the Parallel BE workflow. The columns in the Output worksheet are automatically mapped to the Descriptive Stat object’s Main Mappings panel.
Plot the concentration values over time
-
Go to the Results tab of the BQL Brand object.
-
Right-click the Output worksheet and select Send To > Plotting > XY Plot.
-
Rename the XY Plot object XY Plot Brand vs Generic.
-
Map the data types as follows:
Subject to the Group context.
Time to the X context.
BrandConc_gt_0_01 to the Y context. -
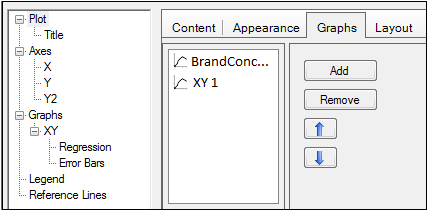
Select Plot in the Options tab menu tree. Select the Graphs tab.
-
Click Add to add a second XY plot to the XY Plot object.
-
Map the Output worksheet from the BQL Generic object as the input source for the second graph:
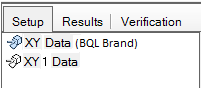
Click the XY 1 Data object in the Setup panel.
In the XY Plot’s XY 1 Data Mappings panel click to open the Select Source dialog.
Select the BQL Generic Output worksheet and click OK. -
Map the data types as follows:
Subject to the Group context.
Time to the X context.
GenericConc_gt_0_01 to the Y context. -
Click
 to execute the object.
Now add a second graph to the XY Plot object.
A second XY Plot input named XY 1 Data is added to the Setup list.
Examine the output in the Results tab. The plot shows that the concentration values peak at very different times for the two formulations.
Plot the mean concentration values over time
-
Go to the Results tab of the Descriptive Stats Brand object.
-
Right-click the Statistics worksheet and select Send To > Plotting > XY Plot.
-
Rename the XY Plot object XY Plot Mean Brand vs Generic.
-
Map the data types as follows:
Time to the X context.
Mean to the Y context.
SD to the Lower Error Bars and Upper Error Bars contexts.
Leave all other data types mapped to None. -
Select Plot in the Options tab menu tree. Select the Graphs tab.
-
Click Add to add a second XY plot to the XY Plot object.
-
Click the XY 1 Data object in the Setup panel.
-
In the XY Plot’s XY 1 Data Mappings panel click
 to open the Select Source dialog.
 -
Select the Descriptive Stats Generic Statistics worksheet and click OK.
-
Map the data types as follows:
Time to the X context.
Mean to the Y context.
SD to the Lower Error Bars and Upper Error Bars contexts.
Leave all other data types mapped to None. -
Click
 to execute the object.
 -
In the Options tab, select Plot and go to the Title tab.
In the title field, type Brand and Generic Mean Concentration. -
Select Axes > X.
In the Range area, select the Custom option button.
In the Minimum field, enter 0.
Leave the Maximum field set to 60. -
Select Axes > Y.
In the Range area, select the Custom option button.
In the Minimum field, enter 0.
Leave the Maximum field set to 30. -
Select Graphs > Mean vs Time (the first one in the list).
-
In the Appearance tab, select Red from the Marker Color menu.
-
In the Marker Border Color menu, select Red.
-
In the Line Color menu, select Red.
Now add a second graph to the XY Plot object.
The plot shows that the mean concentration values peak at very different times for the two formulations.
The plot does not place the points close to the axes, it is hard to differentiate between the overlaid plots, and the plot does not have a title. Use the Options tab to change the X and Y axes ranges, change the plot colors, and add a title.
The Descriptive Stats Brand plot is now highlighted in red.
The plot is automatically updated to reflect the new axes ranges, plot colors, and the title. Note that the XY Plot object did not have to be re-executed.
The final plot looks like this:
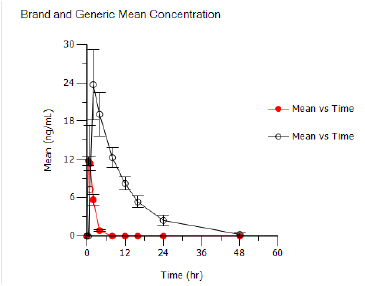
XY plot showing brand and generic mean concentrations
Set up two noncompartmental analysis objects
-
Go to the BQL Brand object’s Results tab.
-
Right-click the Output worksheet and select Send To > NCA and Toolbox > NCA.
-
Rename the NCA object NCA Brand.
-
Map the data types as follows:
Subject to the Sort context.
Time to the Time context.
BrandConc_gt_0_01 to the Concentration context. -
Select Dosing in the NCA Setup tab.
-
Drag the Pococuranitol_dose worksheet from the Data folder to NCA Brand’s Dosing Mappings panel.
-
Map Subject to Sort, Time_of_Dose to Time and Dose to Dose.
-
Click
 to execute the object.
 -
Go to the BQL Generic object’s Results tab.
-
Right-click the Output worksheet and select Send To > NCA and Toolbox > NCA.
-
Rename the NCA object NCA Generic.
-
Map the data types as follows:
Subject to the Sort context.
Time to the Time context.
GenericConc_gt_0_01 to the Concentration context. -
Select Dosing in the Setup tab.
-
Drag the GenericForm1_dose worksheet from the Data folder to NCA Generic Dosing Mappings panel.
-
Map Subject to Sort, Time_of_Dose to Time and Dose to Dose.
-
Click
 to execute the object.
In this example one dose of 50 mg was administered at time zero. The Pococuranitol workbook has dosing data stored in the Pococuranitol_dose worksheet.
Note:If the Pococuranitol_dose worksheet is not viewable in the Object Browser, expand the Pococuranitol workbook in the Data folder by clicking the (+) sign.
In this example one dose of 50 mg was administered at time zero. The GenericForm1 workbook has dosing data store in the GenericForm1_dose worksheet.
Create the formulation dataset for the bioequivalence model
Combine the Final Parameters Pivoted worksheets from both NCA objects and use the combined output in a bioequivalence model. The new column created by the Append Worksheets object will contain the formulation information for the bioequivalence model.
-
Go to NCA Brand object’s Results tab.
-
Right-click the Final Parameters Pivoted worksheet and select Send To > Data > Append Worksheets.
-
Map the data types to the following contexts:
Subject to the Source Column context.
Cmax to the Source Column context.
AUClast to the Source Column context.
Leave all other data types mapped to None. -
Click the Worksheet2 object in the Setup panel.
-
In the Append Worksheets object Worksheet 2 Mappings panel click
 to open the Select Source dialog.
 -
Select NCA Generic Final Parameters Pivoted worksheet and click OK.
-
Map the data types as follows:
Subject to the Source Column context.
Cmax to the Source Column context.
AUClast to the Source Column context.
Leave all other data types mapped to None. -
Click
 to execute the object.
Set up the first bioequivalence model
-
Right-click the Append Worksheets object’s Result worksheet and select Send To > NCA and Toolbox > Bioequivalence.
-
Map the data types as follows:
Formulation to the Source context.
Subject mapped to None.
Cmax to the Dependent context.
AUClast to the Dependent context. -
In the Model tab, select the Parallel/Other button to set the model to a parallel bioequivalence model.
Leave Reference Formulation set to NCA Brand. -
Click
 to execute the object.
Examine the output in the Results tab.
Create and add a template
In Phoenix templates, any data mappings that are internal to the workflow are retained. For example, all expected output from the BQL objects, such as subject, time, and concentration, are retained in the NCA objects’ Main Mappings panel. Mappings that are external to the template, such as the BQL rules and the datasets used with the BQL objects are not retained.
-
Select the Parallel BE workflow.
-
Click
 in the Phoenix toolbar to save the workflow as a template.
 -
In the Save Workflow Template dialog, leave the default file name as Parallel BE.
-
Click OK.
-
Select File > Load Workflow Template.
-
In the Import File(s) dialog, select Parallel BE.phxtmplt in the <default Project directory>/templates directory and click Open.
The Save Workflow Template dialog is displayed.
The workflow is saved as a Workflow Template file in the location set in the Preferences dialog (by default <default Project directory>/templates) and named Parallel BE.phxtmplt.
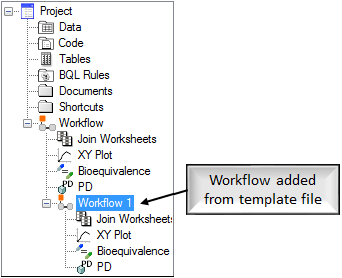
The template is added to the project as a second workflow. The second workflow is nested below the first one. The new workflow is named Parallel BE 1.
Note:All references to workflows and operational objects in this section of the example refer to the Parallel BE 1 workflow and the operational objects it contains.
Set up the objects in the template workflow
-
Select the Parallel BE 1 workflow object in the Object Browser.
-
Click the chevron
 buttons to expand BQL Brand and BQL Generic.
 -
Click the (+) symbols to expand Rule Sets for both BQL objects.
-
Drag the Rule Set from the BQL Rules folder in the Object Browser to the Rule Set input for both BQL Brand and BQL Generic.
-
Select BQL Brand in the Parallel BE 1 workflow.
-
Drag the Pococuranitol_data worksheet from the Data folder to BQL Brand’s Main Mappings panel.
-
Click
 to execute the object.
 -
Select BQL Generic in the Parallel BE 1 workflow.
-
Drag the GenericForm2_data worksheet from the Data folder to the Main Mappings panel.
-
Click
 to execute the object.
 -
Select Descriptive Stats Brand in the Object Browser.
-
Select Descriptive Stats Generic in the Object Browser and click
 to execute.
 -
Select XY Plot Brand vs Generic in the Object Browser and click
 to execute.
 -
Select XY Plot Mean Brand vs Generic in the Object Browser and click
 to execute.
 -
Select NCA Brand in the Object Browser.
-
Select Dosing in the Setup list.
-
Drag the Pococuranitol_dose worksheet from the Data folder to the Mappings panel.
-
Map Subject to Sort, Time_of_Dose to Time and Dose to Dose.
-
Click
 to execute the object.
 -
Select NCA Generic in the Object Browser.
-
Select Dosing in the Setup list.
-
Drag the GenericForm2_dose worksheet from the Data folder to the Mappings panel.
-
Map Subject to Sort, Time_of_Dose to Time and Dose to Dose.
-
Click
 to execute the object.
 -
Select Append Worksheets in the Object Browser and click
 to execute the object.
All mappings and options have been carried over from the original object. Do not change them.
Note:Descriptive Stats Brand used BQL Brand’s output as its input and BQL Brand has been executed in the second workflow, therefore, no changes to the object are needed. The same is true for Descriptive Stats Generic, XY Plot Brand vs Generic, XY Plot Mean Brand vs Generic, and Append Worksheets objects.
The plot shows that the concentration values peak at very different times in the two different study groups. The second generic formulation lasts longer and has much higher concentration values than the brand name formulation.
The plot shows that the mean concentration values peak at very different times in the two different study groups.
Note:The dosing data came from a data source external to the template, therefore, the Dosing tab needs to be re-mapped for NCA Brand and NCA Generic objects.
Set up the second bioequivalence model
-
Right-click the Append Worksheets object’s Result worksheet and select Send To > NCA and Toolbox > Bioequivalence.
-
Examine the output.
-
Right-click the project and select Close Project.
All mappings and options have been carried over from the original object.
Click  to execute the object.
This concludes the Workflows and Templates example.
