The Model Text tab displays the PML (Phoenix Modeling Language) code that is generated when a model is specified. Phoenix generates the PML code based on the options selected in the Structural and Parameters tabs. The Model Text tab also automatically provides column definitions for the model.
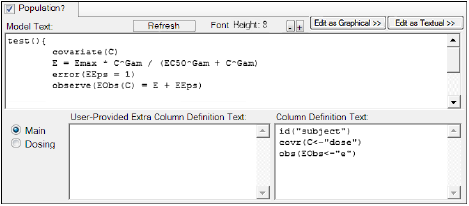
The PML code is displayed in the Model Text field. The PML code updates automatically when any changes are made in the Phoenix Model.
-
Click Refresh to update the PML code.
-
Click (-) to decrease the size of the model text and the column definition text.
-
Click (+) to increase the size of the model text and the column definition text.
PML code in the Model Text field cannot be edited. The PML code can only be edited when the Text Model mode is selected. The column mappings are displayed in the Column Definition Text field and cannot be edited. They are created from the mappings in the Main Mappings panel and the Dosing panel. -
Select the Main option button to view the column definition text for the main mapping contexts.
-
Select the Dosing option button to view the column definition text for the dose mapping contexts.
-
In the User-Provided Extra Column Definition Text field, type any extra column mappings that are not automatically generated in the Column Definition Text field. See “Extra Column Definitions” for more details about this option.
Users are not expected to add extra column definitions in the Model Text tab unless it becomes necessary, for example, to use a column for two separate contexts in a model.
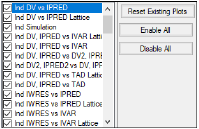
The Plots tab allows users to select individual plots to include in the output.
-
Use the checkboxes to toggle the creation of graphs.
-
Click Reset Existing Plots to clear all existing plot output.
Each plot in the Results tab is a single plot object. Every time a model is executed, each object remains the same, but the values used to create the plot are updated. This way, any styles that are applied to the plots are retained no matter how many time the model is executed.
Clicking Reset Existing Plots removes the plot objects from the Results tab, which clears any custom changes made to the plot display. -
Use the Enable All and Disable All buttons to check or clear all checkboxes for all plots in the list.
The WARNNGS/no warnings tab displays any problems with the model data mappings and settings. If there are any problems, the tab is labeled WARNINGS. If there are no problems, the tab is labeled no warnings.
The Remote Execution Log tab displays the log that is kept when jobs run on a remote system.
