The following options are available under the General Settings node. You can override any parameters set under this node for individual tables or graphs found under the applicable node, such as PK Automation or PK Comparison. For example, the administrator can select to allow the user access to specific parameters for specific types of studies. For a specific example, see “Selecting content for generated output”.
On the Available to User tab, the administrator determines which PK parameters are available to the user for inclusion in generated output on a model-specific basis. If you clear a parameter checkbox on this page, then it is also unavailable for individual selection under the PK Automation node, when selecting details on tabular and graphical output.
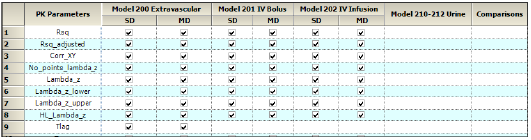
Available to User tab
On the User Default Selection tab, the administrator determines whether a PK parameter is included in all of the generated output by default. The user can then choose to not include a given parameter on a per-run basis.
An administrator can configure variables and their associated descriptive statistics and precision.
Using the Variables tabs, an administrator can determine which demographic and data collection points (DCP) are available to users and which are selected by default in the AP Automation object. An administrator can define discrete demographics which are used in stratifications, continuous demographics, which are used in normalizations, or sample collection points.
-
With the Category set to Discrete Demographics or Continuous Demographics, click Edit Master List to add or remove custom demographic variables.
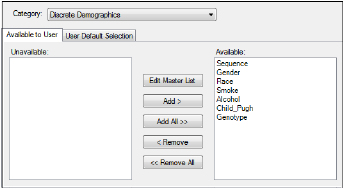
Variables tab
-
In the dialog, click Add to add custom System and Client Name variables.
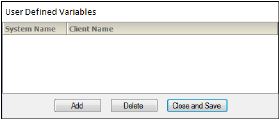
User Defined Variables dialog
-
Click Delete to remove a demographic variable, and click Close and Save to add the new demographic variable.
Using the Statistics tabs, an administrator can determine which statistical variables along with their order of display in worksheet output are available to the user and which are included by default. Statistical variables are available for all study variables and PK parameters.
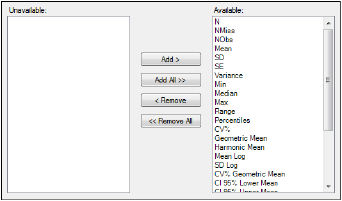
Statistics tab
Using the Precision tab, an administrator can set the precision type, decimal or significant digits, and the corresponding value for each variable and statistic combination.
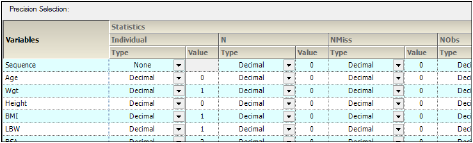
Precision tab
An administrator can use column mapping to apply an organization’s settings regarding input or study data and output nomenclature for PK parameters by using the Study Variables tab, PK Parameters tab, Concentration Variable Template Selection tab, and Time Variables tab.
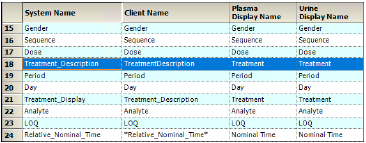
In the Study Variables tab, an administrator can change the default names in AutoPilot Toolkit, which are called System names, to match what is used in the study data, or the Client name. The Plasma and Urine Display Names show how the variables are displayed in the AP Automation output. The Display names are independent of both System names and Client names and can be changed at any time. To support stacked datasets a new column called Analyte is included in the Study Variables tab.
Note:The Plasma and Urine Display Names for Treatment_Description cannot be changed because they are not used in the output. The Display Names for Treatment_Display are used instead.
Treatment_Description and Treatment_Display
AutoPilot Toolkit's default behavior requires the use of a Treatment_Description column in datasets as a sort variable for crossover studies. Treatment_Description in AutoPilot Toolkit can be mapped to whatever column in a dataset that contains treatment information.
Some datasets use a treatment information column that solely contains alphanumeric values (1, 2, A, or B, for example) that are used as sort variables in a model, and a treatment display column that is used to display meaningful treatment information in table and graph output.
AutoPilot Toolkit provides a study variable, Treatment_Display, that allows for meaningful treatment descriptions in table and graph output instead of simply 1, 2, A, or B.
The treatment display order is displayed in the Treatments tab in the AP Automation object’s Ordering tab. The Treatment Description values are matched to the corresponding Treatment Display values. There must be a one to one correspondence between the Treatment_Description and Treatment_Display values.
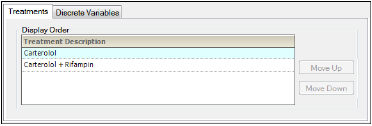
Default treatment order
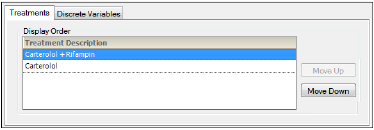
Custom treatment order
If a user wants to use a custom treatment display, an administrator must change the treatment sort variable from its default setting to a custom setting. If a dataset contains Treatment and Treatment_Description columns, and a user wants to set Treatment as the NCA model’s sort variable and include Treatment_Description in the output, an administrator must make the following changes:
-
Open the Admin Module.
-
In the Admin Module menu, select Config > General > Column Mapping.
-
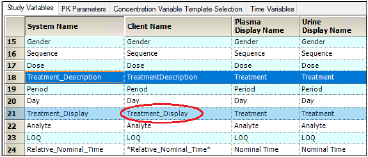
Select the Treatment_Description Client Name field. Change the Client Name to Treatment.
The System Name Treatment_Display is mapped to Treatment_Description by default.
-
If needed, change the default mapping by selecting the Treatment_Display Client Name field. Change the Client Name to the treatment description variable in the input dataset.
Note:Treatment_Display can be mapped to any column in a dataset.
-
Click
 to save the custom System Config file.
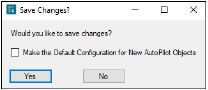
Save Changes? dialog
-
To make this configuration the default one, select the Make Default Configuration checkbox in the Save Changes? dialog.
-
Click Yes to save the system configuration file.
To load a custom configuration file in the Admin Module
-
Open the Admin Module.
-
Click
 to select a custom configuration file.
Users can only load a custom configuration file before mapping an input dataset to the AP Automation object.
-
Select the Use Custom Configuration option button in the General tab.
-
Click the Browse...
 button to browse to the custom system configuration file.
 -
Select the file in the Select System Configuration dialog and click Open.
-
Click Set as Default to set the custom configuration as the default configuration.
Default study variables
Custom study variables
Note:If Treatment_Display is not in the dataset, AutoPilot Toolkit displays a warning and defaults to the Client Name that Treatment_Description is mapped to. Users can either fix the problem or proceed with the project.
If the Treatment and Treatment_Display columns do not match with unique values, AutoPilot Toolkit gives an error message and does not allow the user to proceed with the project until the problem is fixed.
While LOQ numbers can be set on a run-by-run basis, AutoPilot Toolkit can also be configured to read LOQ values from a data column by mapping the LOQ system name to the correct column.
For wide data, a cell in the LOQ column can be empty or contain a value. However, the LOQ value must be the same for all concentration variables that use the column. For example, wide data can contain an LOQ column with empty cells and cells with a value of 0.05.
For data stacked by analyte, a different LOQ value can be set for each analyte. The value for LOQ must be the same across a single analyte. For example, the following table depicts data stacked by analyte for three analytes.
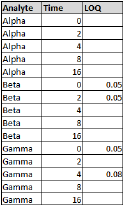
Example of data stacked by analyte
In this case, the Alpha analyte will have no LOQ, the Beta analyte will have an LOQ of 0.05, and the Gamma analyte will have no LOQ: if different LOQ values are entered for the same analyte, they are all ignored.
-
To use LOQ values from the data columns, select the Output Options tab in the AP Automation object.
For more information see “Display tabs”.
In the PK Parameters tab, an administrator can set the display name, which is used in the final generated output, and the file name, which determines the root name of the graph output file for a specific parameter (AUClast.jpg, for example). The display name can have superscripts, subscripts, and some symbols.
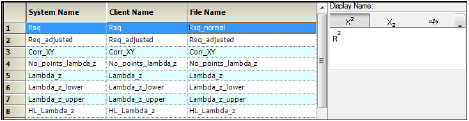
PK Parameters tab
To set the file name
-
Select a parameter in the File Name column.
-
Change the file name.
To set the display name
-
Select a PK Parameter.
The parameter is displayed in the Display Name area.
-
Modify the parameter display name by clicking the Superscript or Subscript button.
-
Add a symbol to the parameter display name by selecting one in the Symbols menu.
Concentration Variable Template Selection tab
On the Concentration Variable Template Selection tab, administrators can set the mapping for the Concentration Variable column by using the pointer to drag the matrix [M], analyte [A], route [R], and asterisk [*] symbols from the Palette to the Template, or by typing a base name in the Base Name field.
Note:In order to support a greater variety of concentration columns, the concentration variable template now contains an asterisk [*] as a wildcard field.
As shown below, no route is selected and the base name is Conc, so the column name is defined by the template [Matrix]_[Analyte]_*Conc*.
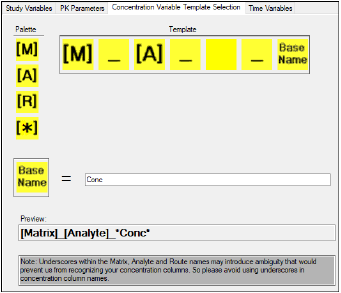
Default Concentration Variable Template Selection tab
Concentration variable template using an asterisk
Some concentration column names in datasets that must be supported by AutoPilot Toolkit have components set off by underscores that are neither analytes, matrices, routes, or base names. For example, Concentration_1, Concentration_2, and Concentration_3. or the name of the compound being tested. To handle a greater variety of concentration columns, the concentration variable template recognizes a wildcard field with an asterisk [*].
For example, if the concentration column name is PLS_XYZ_PKConc, use the following steps to change the concentration variable template:
-
Use the pointer to drag [A] (analyte) from the Template to the Palette.
-
Use the pointer to drag [*] (asterisk) from the Palette to the Template to allow AutoPilot Toolkit to bypass the XYZ part of the name.
The column name PLS_XYZ_PKConc is defined by the template [Matrix]_[*]_*Conc*.
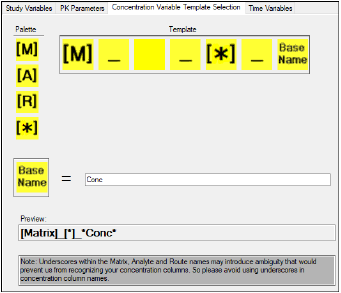
Concentration Variable Template using asterisk
Concentration variable template selection for stacked data
To use stacked data, use the pointer to drag [A] (analyte) to the Pallet. The column name is defined by the template [Matrix]_ *Conc*.
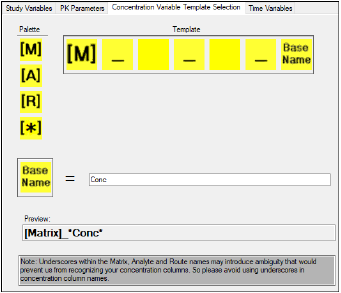
Concentration Variable Template used for stacked data
The AutoPilot Toolkit project AutoPilot Comparison Demo - Stacked Data.phxproj is located in …\Examples\AutoPilot. This project file can be used to run a comparison project using stacked data. Users can compare the output from a stacked data comparison project with the output from a wide data comparison project.
Missing analyte columns
An analyte must be present in a data column in order for AutoPilot Toolkit to recognize a stacked dataset. If an analyte column is not present, the data is analyzed as if it was wide data.
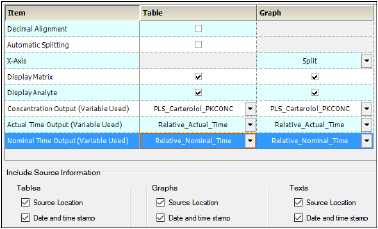
The Time Variables tab is used to set the default time variables and to map the Relative and Nominal start and end times to the correct column names in the dataset. Users can select the time variable to map, and enter the input data variable name in the Identifying Text field.
In the screen shot below, Time is entered as the identifying text for Relative Nominal End Time. This means that AutoPilot Toolkit will select all columns with Time in the name.
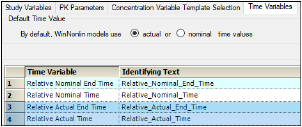
Time Variables tab
When an AP Automation object is created, users have the option to select which column to use. See “Display tabs”.
Time variable column selection
