The Context Sensitive Footnotes tab under General business rules contains a list of non-numeric default values. For example, NRC and EM are assigned the corresponding strings “No Sample Received” and “Extensive Metabolizer” (respectively), which serve as footnotes for worksheet output.
The Enabled checkbox controls whether or not the context-sensitive footnote rules are applied.
In the Context Sensitive Footnotes tab, administrators can add footnotes to or remove footnotes from this list by clicking Add and Remove. Administrators can also set Key and Footnote values and configure whether matching values are set equal to zero when calculating summary statistics or if the data should not be included (missing), which decreases the n-value.
In addition, administrators can configure which of the non-numeric values and corresponding footnotes are associated with the LOQ rule set. See “LOQ replacement”.
|
Key |
Footnote |
Summary Stat Calculation |
LOQ GUI Overwrite |
|
LOQ |
LOQ: Lower limit of quantification. |
Zero |
No |
|
BQL |
BQL: Below limit of quantification. |
Zero |
No |
|
HEM |
HEM: No sample, hemolyzed. |
Missing |
No |
|
NRC |
NRC: No sample received. |
Missing |
No |
|
INS |
INS: Insufficient volume to analyze. |
Missing |
No |
|
PLC |
PLC: Placebo, not analyzed. |
Missing |
No |
|
BLK |
BLK: Blank, not analyzed. |
Missing |
No |
|
NBC |
NBC: No barcode, not analyzed. |
Missing |
No |
|
NRI |
NRI: Assay interference, not analyzed. |
Missing |
No |
|
EM |
EM: Extensive Metabolizer |
Missing |
No |
|
PM |
PM: Poor Metabolizer |
Missing |
No |
More on the LOQ GUI Overwrite option
-
If the LOQ GUI Overwrite is set to No or if an LOQ value is not entered in an AP Automation object, then the Context Sensitive Footnote rules for calculation of summary statistics applies.
-
If the LOQ GUI Overwrite is set to Yes and an LOQ value is entered in an AP Automation object, then the Context Sensitive Footnote Rules for the calculation of summary statistics is disabled, and the LOQ Replacement rules apply.
The LOQ GUI Overwrite feature associated with these rules and the context-sensitive footnotes work as illustrated in the following table. Note that the settings in the third case potentially create two different footnotes for the same entry in the concentration table and should be avoided by the administrator.
|
Data Values |
Context-Sensitive Footnote |
LOQ GUI Overwrite |
LOQ Replacement Setting |
Resulting Display in Table (values, footnote) |
|
BQL 0.4 10.0 |
BQL: CSF footnote |
No |
Value: 0.5 Replacement: LLOQ Footnote: LLOQ: LOQ footnote |
BQL LLOQ 10.0 Footnotes BQL: CSF footnote LLOQ: LOQ footnote |
|
BQL 0.4 10.0 |
BQL: CSF footnote |
Yes |
Value: 0.5 Replacement: LLOQ Footnote: LLOQ: LOQ footnote |
LLOQ LLOQ 10.0 Footnotes LLOQ: LOQ footnote |
|
BQL 0.4 10.0 |
BQL: CSF footnote |
No |
Value: 0.5 Replacement: BQL Footnote: LLOQ: LOQ footnote |
BQL BQL 10.0 Footnotes BQL: CSF footnote BQL: LOQ footnote |
|
BQL 0.4 10.0 |
BQL: CSF footnote |
Yes |
Value: 0.5 Replacement: BQL Footnote: BQL: LOQ footnote |
BQL BQL 10.0 Footnotes BQL: LOQ footnote |
For non-analyte comparisons, each automation run applies its own LOQ and AUC%Extrap rules. However, only the rule for the reference study gets footnoted in the output. For plasma analyte comparisons, if there is a LOQ value set in the reference study, those same settings are used in the comparison.
Footnotes for graphs and/or tables can be selected and cleared in the Footnotes tab. An administrator can manage footnotes in the Tables and Texts and Graphs areas. When the Provide source footnotes checkbox for graphs is selected, the checkboxes in the Include Source Information (Integral) areas are selected. checkboxes for each footnote can then be selected or cleared. Clearing the Provide source footnotes checkbox disables all footnotes. When a table or graph footnote is disabled, the area is made unavailable.
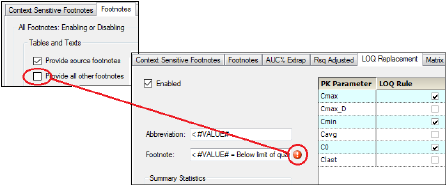
Footnote disabled for LOQ replacement
Multiple footnotes can be managed in the Footnotes tab. Settings made in the tab override any local settings, although the local settings can still be edited.
PK parameter percent-extrapolated threshold
PK parameters that rely on the regression can be altered in the final presentation of graphs and worksheets. Administrators can choose to apply the rules by turning on the Enabled checkbox.
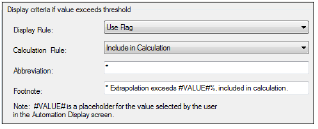
The display rules can be configured as follows:
-
Specify whether the extrapolated value is to be based on Observed or Predicted data (pred or obs).
-
Define a flag or replacement value for these PK values, with a corresponding footnote.
The default is to flag the value with an asterisk when the value is greater than a value set in the User Module and to provide a corresponding footnote: “* - Extrapolation exceeds #VALUE#%”, where #VALUE#% is the user-defined value.
If the individual values are flagged, they are still displayed in the graphs. However, if individual values are replaced with non-numerical values, they are not displayed in the graphs. The summary values are displayed the same for both graphs and tables.
-
Specify whether or not values that exceed the threshold are to be included in summary statistics and derived parameter calculations.
Default display settings for parameter values exceeding the threshold
-
Administrators can configure which, if any, PK parameters are affected by this rule by turning on the corresponding checkbox in the table. This selection applies to both graphs and tables. Default parameters include any PK Parameter that uses the regression fit as part of its computation, including Volume, Clearance, any ‘infinity’ and ‘tau’ parameters, Half-Life, Lambda z, and Partial AUCs.
PK parameter Rsq adjusted threshold
PK parameters that rely on the regression can be altered in the final presentation of graphs and worksheets. Administrators can choose to apply the rules by turning on the Enabled checkbox.
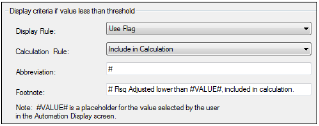
The display rules can be configured as follows:
-
Define a flag or replacement value for these PK values, with a corresponding footnote.
The default is to flag the value with a hash sign when the value is greater than a value set in the User Module and to provide a corresponding footnote: “# - Rsq Adjusted lower than #VALUE#, included in calculation”, where #VALUE# is the user-defined value.
If the individual values are flagged, they are still displayed in the graphs. However, if individual values are replaced with non-numerical values, they are not displayed in the graphs. The summary values are displayed the same for both graphs and tables.
-
Specify whether or not values that exceed the threshold are to be included in summary statistics and derived parameter calculations.
Default display settings for parameter values exceeding the threshold
-
Administrators can configure which, if any, PK parameters are affected by this rule. This selection applies to both graphs and tables. Default parameters include any PK Parameter that uses the regression fit as part of its computation, including Volume, Clearance, any ‘infinity’ and ‘tau’ parameters, Half-Life, Lambda z, and Partial AUCs.
Limit of quantification (LOQ) replacement affects both tables and graphs for NCA models 200–202 and Trough only. It applies only if the automation user enters a value in the LOQ field of the Display - Output Options tab of the AP Automation object (see the “Output Options tab” section). If a user enters an LOQ value, values in the Concentration tables that are less than the LOQ and affected individual PK parameters (Cmax, for example) are replaced with a text value, such as <#VALUE#, where #VALUE# is the LOQ. Since they are replaced with text values, LOQ values are not displayed in graphs.
All Concentration graphs and some PK parameter graphs include a horizontal line at the value of the LOQ and a legend item identifying this line.
The display rules can be configured as follows:
-
Use the Enabled checkbox to apply the rules.
-
Define a replacement value for these PK values, with a corresponding footnote.
The default is to replace the original value with < #VALUE# when it is less than a value set in the User Module and to provide a corresponding footnote: “< #VALUE# = Below limit of quantification (#UNITS#)”, where #VALUE# is the user-defined value and #UNITS# are the units of the column used in the y-variable of the model (ng/mL, for example).
-
Specify if values below the threshold are to be included in summary statistics and derived parameter calculations as Zero, Missing, or a certain fraction of the specified LOQ value (Derivation).
-
Indicate whether multiple footnotes are to be identified using letters or numbers.
-
Administrators can configure which, if any, PK parameters are affected by this rule, in addition to concentration tables. The complete list of PK parameters is Cmax, Cmax_D, Cmin, Cavg, C0, Clast. By default, the rule is applied to Cmax, Cmin, and C0.
The Matrix Mapping tab allows administrators to specify matrix names in graph and table output. The matrix names used in the input study data are listed in the Study Data Column Header Matrix Value column.
Administrators can choose to apply the rules by turning on the Enabled checkbox.
Complete names can be entered for the study data matrices in the Full Text Displayed In Output column. For example, PLS in the concentration column is displayed as Plasma in AutoPilot Toolkit output.
The Type of Matrix Value column allows administrators to specify whether the matrix is Non-urine or Urine.
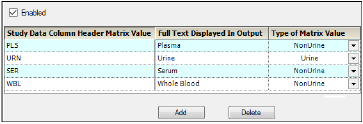
Matrix Mapping tab
Administrators can add matrix names to or remove matrix names from this list by clicking Add and Delete.
Summary stat calculation criteria
Administrators can choose to apply the rules by turning on the Enabled checkbox.
Values of summary statistics with small sample sizes can be overwritten by text values with corresponding footnotes. Administrators can set the following options:
-
The text value and footnote applied for the overwritten statistics. This setting applies to all summary statistics. The user can set the footnotes based on output type. The default value is “NC” with footnote: “NC = Not Calculated” for both of the output types. Depending on the output type (Time Concentration/PK Parameter) the corresponding value is displayed in the tables. If a value is changed to non-numeric (e.g., NC) in the tables, this value is not displayed in the graphs.
-
The text value and footnote applied for the overwritten statistics when the number of samples is less than the specified minimum. The user can set the footnotes to appear in tables and/or graphs. The default is to apply the value (a solid circle) and footnote (“Small sample size rule applied to calculation of summary variable”) to tables and graphs. In graphs, a single footnote is displayed at the bottom of the graph. In worksheets, the footnote is displayed on a statistic by statistic basis.
-
The text value and footnote applied when a value of zero is set to be treated as a missing value. The user can set the footnotes to appear in tables and/or graphs. The default is to apply the value (an empty circle) and footnote (“Zero treated as missing for calculation of statistics”) to tables and graphs.
There are two business rules that can be used to set minimum sample size:
-
the absolute number of values required
-
the minimum percentage
If both of these business rules are used in conjunction with one another, both minimum sample size business rule conditions must be met before the summary statistics are calculated and displayed in the tables.
-
Turn on the Apply Zero as missing only under Small Sample Size checkbox to set zero values as missing only when the Small Sample Size rule is not met.
-
Turn on the Do Not Overwrite LOQ Summary Statistics Replacements to retain the LOQ summary statistics values.
-
Turn on the Do Not Use Raw Data for Small Sample Size checkbox to prevent small sample size from using raw values of data.
-
Administrators can configure which, if any, PK parameters are affected by the rules. Turn on the Select checkbox to apply the rule to the parameter. For the minimum sample size, select the value from the pull-down menu. For the sample percentage, enter the minimum percentage, relative to the total sample size, that must exist in a profile before summary statistic calculations are performed. (This percentage is calculated as the number of non-missing, non-alphanumeric values divided by the total number of samples.)
By default, the minimum sample size of two rule is applied to all PK parameters.
-
Turn on the Treat zero as missing checkbox for a summary statistic to allow values of zero to be treated as though they were missing during the calculation.
Note:When loading a saved system XML file in which the small sample size is set to a value other than the default, you may have to reset that value. There are situations that can cause the small sample size for certain summary statistics to become frozen at a value of 1, so the value in a saved system XML file may be ignored.
The general exclusion display rules can be configured as follows:
-
Turn on the Enabled checkbox to apply the rules.
-
Define a replacement value for excluded values in tables, with a corresponding footnote.
The default is to replace the excluded value with an asterisk and to provide a corresponding footnote: “Excluded from the calculation of descriptive statistics”.
-
Turn on the Apply as Default Time Point Exclusion to Concentration Tables checkbox to have the Apply Time Point Exclusion to Concentration Tables option in the User mode checked by default.
-
Define a replacement value for excluded values in graphs.
The default is to replace the excluded value with a cross hair symbol (+).
