Select the NLME model to run in the main Pirana window.
Right-click the selected model and choose RsNLME shiny > Run Initial Estimates.
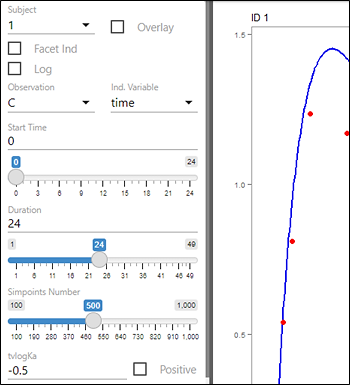
The current initial estimates are loaded and a graph generated. The graph is interactively updated as adjustments to settings are made using the provided tools.
Select the Subject from the pulldown to display the corresponding data points in the graph.
Check the Overlay box to display data points for all subjects in the graph.
Check the Facet Ind box to split the graph into a separate graph for each individual.
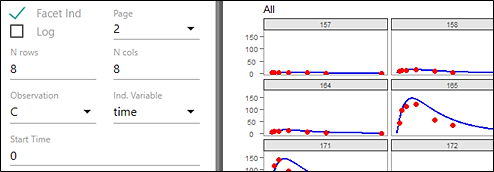
Use the Page menu to jump to a different page of graphs.
Use the N rows and N cols fields to define the rows and columns of graphs to display on a page.
Check the Log box to change to a logarithmic scale in the graph (the graph is linear when unchecked).
Change the Observation and Ind.Variable being displayed in the graph using the respective menus.
Use the Start Time field to enter the X axis origin or use the slider to set the value.
Use the Duration field to enter the end value of the X axis or use the slider to set the value.
Use the Simpoints Number slider to set the number of simulation points to generate (up to 1000).
For each fixed effect, enter an initial estimate value and check the Positive box if covariate values are all positive.
When adjustments have been made and you are satisfied with the graph(s), click EXIT at the top of the window. In the confirmation popup, press Save and Exit to update the fixed effects in the model or press EXIT to close the window without applying the adjustments.