The InitialEstimates Shiny app opens in a browser window. The current initial estimates are loaded and a graph generated. The graph is interactively updated as adjustments to settings are made using the provided tools.
Select the NLME model to run in the main Pirana window.
Right-click the selected model and choose RsNLME shiny > InitialEstimates.
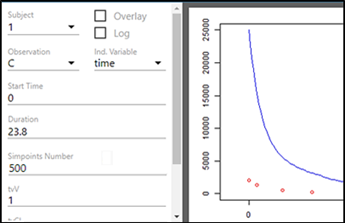
Select the Subject from the pulldown to display the corresponding data points in the graph.
Check the Overlay box to display data points for all subjects in the graph.
Check the Log box to change to a logarithmic scale in the graph (the graph is linear when unchecked).
Change the Observation and Ind.Variable being displayed in the graph using the respective menus.
Use the Start Time field to enter the X axis origin.
Use the Duration field to enter the end value of the X axis.
Use the Simpoints Number field to enter the number of simulation points to generate (up to 1000).
For each fixed effect, enter an initial estimate value.
When adjustments have been made and you are satisfied with the graph, scroll to the bottom of the window and click SAVE & EXIT to close the window and return the adjusted estimate values to your model.