-
Import results of an NLME run into xpose database to create commonly used diagnostic plots.
-
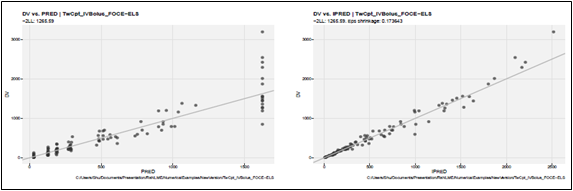
Observations against population or individual predictions
-
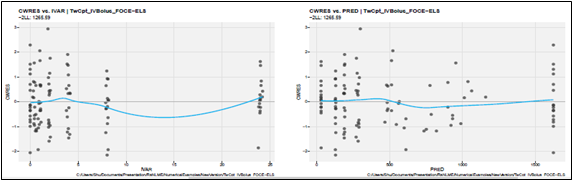
CWRES against independent variable or population predictions
xp <- xposeNlme (dir = model@modelInfo@workingDir , modelName =
ModelName )
dv_vs_pred (xp , type = "p", subtitle = " -2LL: @ofv ")
dv_vs_ipred (xp , type = "p", subtitle = " -2LL: @ofv , Eps shrinkage
: @epsshk ")
res_vs_idv (xp , res =" CWRES ", type ="ps", subtitle =" -2LL: @ofv ")
res_vs_pred (xp , res =" CWRES ", type ="ps", subtitle =" -2LL: @ofv ")