Pirana has the ability to create interactive scripts, meaning that upon execution of an R-script, the user will be presented with a dialog that asks for plotting and input options. The plotting options can be specified in the R-script. For example:
### <arguments>
### <title label="Plot title">DV vs PRED</title>
### <x_var label="X-variable">DV</x_var>
### <xlab label="x-axis label">Dependent variable</xlab>
### <y_var label="y-variable">PRED</y_var>
### <ylab label="y-axis label">Pred. concentration</ylab>
### <subset label="Subset string"></subset>
### <split_id label="by ID" type="bool">FALSE</split_id>
### </arguments>
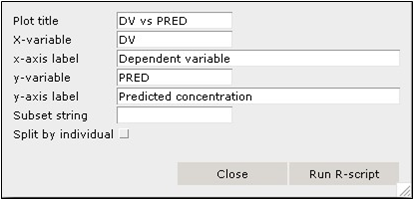
This will result in the following interface:
In the R-script, the specified options are then available as the list arg using:
ggplot (data=tab, aes (x=get(arg$x_var),
y=get(arg$y_var))) + geom_point()
