-
Select the model for which you want to create plots.
-
In the right panel, select the desired script from the Scripts tab.
-
Click
 .
.
Or
Right-click the selected script and choose Run script from the menu.
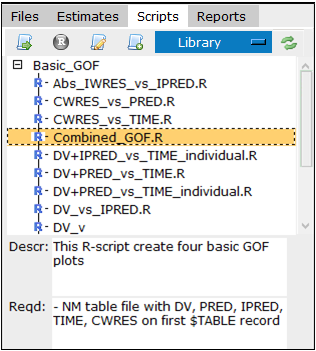
The expected input variables for the selected script are depicted at the bottom of the right panel.
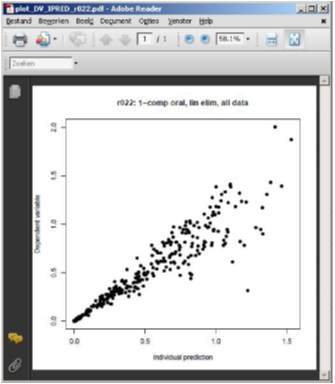
The plot will be created and opened automatically.
Pirana invokes R and runs the script in the directory piranatemp underlying the active folder. However, before execution, Pirana replaces #PIRANA_IN with an R list-object which specifies model and results information. For example:
models <- list (
"003" = list (
"modelfile" = "003.mod",
"description" = "PK model digoxin",
"reference_model" = "002",
"data_file" = "nm_pk_001.csv",
"output_file" = "003.lst",
"tables" = c("003.TAB", "sdtab003")
)
)
