Automated Modeling Workflow Example
An automated workflow for NONMEM models alleviates the burden on modeling scientists by removing the repetitive task of running and evaluating many candidate models, standardizes the model development between modelers, and standardizes the results reported from such an analysis, resulting in higher quality PopPK analyses (Schmidt et al. JPKPD 2014 Aug).
In this tutorial, we will walk through an example of an automated population PK analysis. We will use the template model library provided with Pirana and a (simulated) dataset of an iv-administered drug, also provided with Pirana (demo.csv).
Start Pirana
Create a new project folder.
In Pirana, copy the file demo.csv in the Pirana installation folder (Pirana/automod_library/demo/demo.csv) to your new folder.
Select the Tools > Automated modeling workflow > New analysis menu option.
All models in the library that are available for inclusion in the analysis are listed. Use the filter field for conveniently selecting, e.g., only iv or only oral models. Specification of your input dataset is also done in this step.
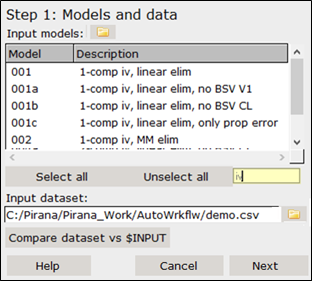
For this analysis, select all iv models by entering iv in the filter field.
Press the Ctrl key and select models 001, 002, 004, and 005 in the list.
Click Compare dataset vs $INPUT. This will bring up the Compare headers dialog.
When models and dataset have been selected, you should check whether the $INPUT record in the models matches with the headers in the dataset.
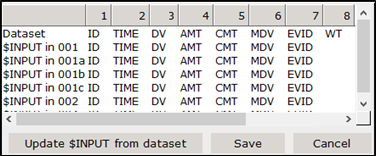
Since $INPUT in the models (shown in rows 2-…) do not match the dataset (shown in row 1), click the Update $INPUT from dataset button.
This creates a new $INPUT record for all models. Then, in a later step, the $INPUT records in all models will be changed to the new one. Be aware that there is no extra check to make sure variables used in the model are still included in $INPUT, you must do this manually.
Click Save and then Next to advance to the next step.
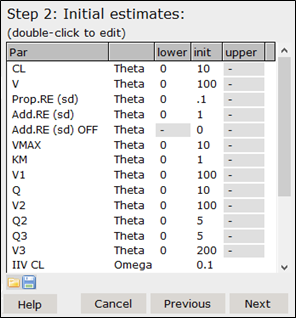
Now we will set initial parameter estimates, as well as lower and upper bounds. All parameters are read from the selected models. The parameter descriptions are defined in the models as comments to $THETA, $OMEGA, and $SIGMA blocks, e.g.,
     $THETA
     (0, 5, 100); CL
     (0, 5, 100); V
     $OMEGA
     (0.1); CL
     (0.1); V
     $SIGMA
     0.05 ; proportional error
Note: Correlations in $OMEGA and $SIGMA cannot be specified for an automated analysis. That is, only the diagonal elements of $OMEGA and $SIGMA can be specified in the template models if you want to update them in this step. You can still include models that have full $OMEGA or $SIGMA blocks as template model, however you cannot provide descriptions (as comments) to the parameters in the block, and you cannot update them in this step of the analysis.
Note: Use the icons below the parameter list to save (![]() ) and load (
) and load (![]() ) parameter definitions to/from a csv file.
) parameter definitions to/from a csv file.
For this analysis, leave the parameters as they are and click Next to advance to the next step.
We can specify where to create the new models and run the analysis. By default, Pirana will generate a sub-folder within the current folder with a name based on the current date.
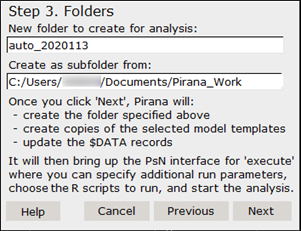
Use the defaults and click Next.
PsN setup
In the PsN Toolkit (execute) dialog, check the Advanced view box to select R scripts (or batch files) to run after (or before) the analysis.
Click ![]() next to the R scripts After run field.
next to the R scripts After run field.
For this analysis, select the NONMEM > Basic_GOF plots as single document to create GOF plots for all models.
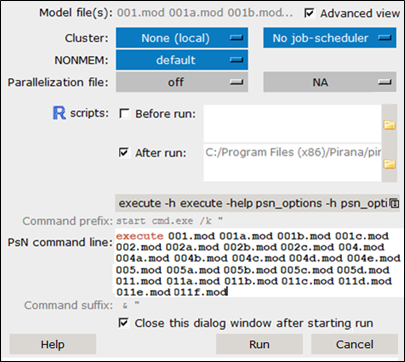
Press Run to execute the workflow.
The graphical report automatically opens once the analysis completes. It is also available from the Reports tab on the right.
Note: If you have not selected R scripts to be executed automatically after the analysis has completed, you can still create them afterwards by selecting the run and executing any R script from the R tab on the right side of the Pirana window.
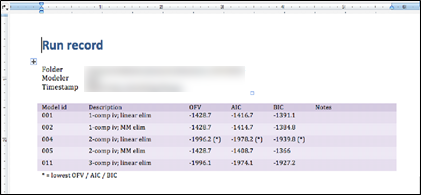
Besides the graphical report, Pirana can generate a numeric report for the analysis, including, e.g., OFVs, basic run information and parameter estimates. This document must be requested manually after the analysis is complete:
With Pirana still in the analysis folder, select Tools > Automated modeling workflow > Report.
The first page is an overview of all models included in the analysis and their respective OFV, AIC and BIC. Subsequent pages include information on each individual run in the analysis.