Select a model with VPC results.
Click ![]() and choose to open the VPC Results Shiny application in the popup.
and choose to open the VPC Results Shiny application in the popup.
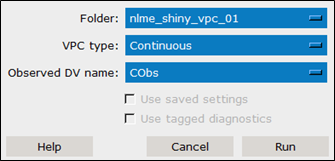
In the dialog:
Select the Folder containing the input data from the menu.
Specify which VPC type to run from the menu.
Select the input column that contains the observed dependent variable data from the Observed DV name menu (only applicable to NLME models).
If you have previously saved your settings from an earlier Model Results session and want to load them, check the Use saved settings box.
If you want to use diagnostics that were tagged in a previous session, check the Use tagged diagnostics box.
Press the Run button to launch the VPC Results Shiny app.
In the Shiny app, you will need to set your parameters in the area on the left and then press the Plot button to populate the tabs on the right.
Note: PREVIEW, TAGGED, and REPORT tabs operate the same as described in the “Model Results” section, with one exception. The Transparency option is set by typing a value between 0 and 1 or by using the up/down arrows to adjust the value.