Pharmacometric model development most often progresses in a hierarchical fashion, using the likelihood ratio test to assess significance of improved fit between nested models. An appropriate visualization of the model hierarchy can help in gaining a better understanding of key stages in model building, and can aid in communicating the model development history to others.
Pirana can generate a visual run record (VRR) for visualizing the model building process from initial to final model. The VRR is an SVG file that contains in interactive tree view of the model development process. Models are related to each other based on Pirana’s reference model tags in the model file.
Select the Results > Run records > Visual run record menu option.

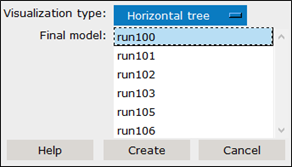
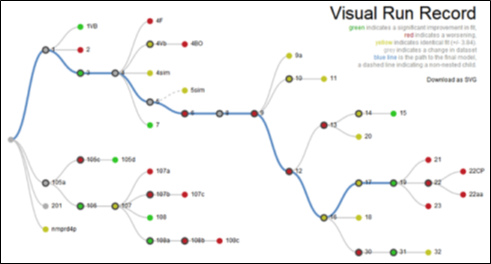
Choose how the data is to be visualized from the Visualization type pull down: as a horizontal tree (shown in the following image), a Tidy tree, a radial tree, or list tree.
Select a final model from the list and press Create.

Colors aid in visualizing the improvement/worsening of model fit (green/red), and whether the model has children or not. In each branch, the nodes are ordered by OFV. When a final model is specified, the modeling path can be made visible as a blue line, thereby easily identifying the key runs.
A variety of slider controls are available on each of the Run Report images for adjusting the 2D appearance of the image through height, width, rotation, etc.