Pirana is able to construct scatter plots using the built-in DataInspector for quickly inspecting goodness-of-fit, covariate relationships, distribution of etas, performing data checkout, etc. The DataInspector shows all the columns present in the dataset, which can be mapped to the X- or Y-axis (shown in following figure).
For a data or table file:
In the Files tab on the right, select a dataset or table file.
Right-click the selected file and choose Open in > DataInspector.
Or
From the Estimates tab on the right, click ![]() in the toolbar.
in the toolbar.
For a model:
In the model overview list, select a model that contains $TABLE records.
Select Results > Open DataInspector from the main menu.
Or
Right-click the selected model and choose Model > Open DataInspector.
Or
Click ![]() in the toolbar.
in the toolbar.
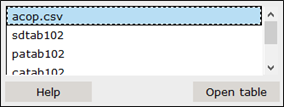
If multiple datasets are available for the model, select the one to inspect in the displayed dialog.
– Press Open table.
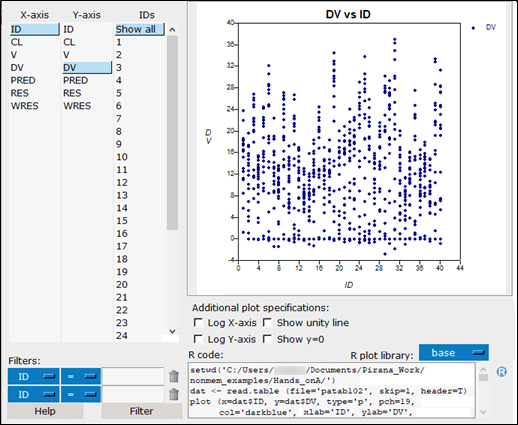
Hovering over a point in the graph will display the value of that data point.
Select a column name from the X-axis and Y-axis lists to switch the information that is plotted in the graph.
Select an ID(s) from the IDs list to only include data associated with the selected ID(s) in the graph. (There is no ID column in the source for the above image.)
Use the Filters pull-downs to define additional filter criteria.
– Select the dataset column name from the first pull-down.
– Select the operator from the second pull-down.
– Enter a value in the field.
– Click ![]() to clear the corresponding criterion.
to clear the corresponding criterion.
– Press the Filter button to add another criterion.
Use the Additional plot specifications checkboxes to change the scaling of the axes (Log X-axis and Log Y-axis), display a unity line (Show unity line), and/or start the Y axis at the origin (Show y=0).
Select the R plot library to use from the pull-down.
In the R code field, edit the R code for generating the plot in R, as needed.
Multiple Y values can be plotted by holding the Control- or shift-key and selecting multiple (up to three) data columns in the DataInspector.
Inside the plot, regions of interest may be selected, which are then zoomed.
Double-clicking inside the plot region changes back to the previous view.
Using the DataInspector tools, data can be filtered, which can be useful, to show only data for one patient, or groups of patients or covariates in the plots.
Hover the cursor over a note to see additional model information.
In the text-box below the plot, code is generated that recreates the same graph in R, either in base, lattice, or ggplot2. This code can be used as a starting point for the generation of plots for manuscripts or reports.
Click ![]() to open the script file within R-GUI or RStudio.
to open the script file within R-GUI or RStudio.
You can execute the script as-is or make modifications to the code and execute. Copying the model text and pasting it into an R-GUI or RStudio script file is also acceptable.
The Correlation Calculator re-calculates a covariance to a correlation on the SD-scale. The formula for correlation that is used is:
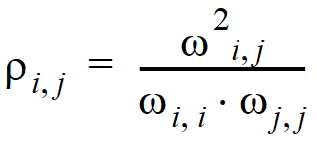
with r specifying the correlation between two elements (i,j) in a matrix, and w specifying elements of W or S.
Select Tools > Correlation calculator from the main menu.
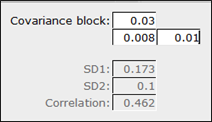
In the dialog, enter covariance values in the appropriate fields.
Resulting standard deviations for each covariant, and the correlation are automatically computed and displayed.
Select csv from the pulldown at the top of the Files tab on the right side of the window.
Select a dataset file from the list.
Right-click the selected file and choose Check dataset from the menu.
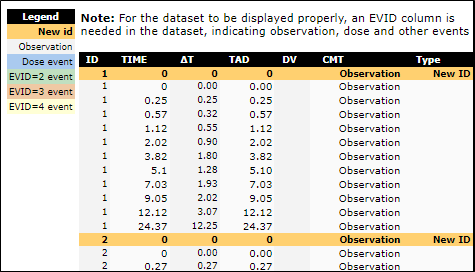
This will create (and open) an HTML file which displays a selected dataset using separate colors for different event types. Thus showing the dataset in a slightly more convenient format for manual inspection than in a spreadsheet. The function needs at least the ID, TIME, and EVID columns in the dataset to work properly.
